Preferences
Privacy is important to us, so you have the option of disabling certain types of storage that may not be necessary for the basic functioning of the website. Blocking categories may impact your experience on the website. More information
Privacy is important to us, so you have the option of disabling certain types of storage that may not be necessary for the basic functioning of the website. Blocking categories may impact your experience on the website. More information

 Looker Studio for SEO: Build a Dashboard, With the Formulas and Limits That Matter
Build a Looker Studio SEO dashboard:  Search Console tables, copyable formulas for brand, directories and AI traffic, data limits and scheduled reports.


In short
Looker Studio is Google's free reporting tool, and for SEO it turns Search Console and Google Analytics 4 data into a dashboard that updates itself. The value is not the charts: it is the calculated fields (brand vs non-brand, page groups by directory, question queries, AI traffic) and knowing the data's limits, such as the 50000-row daily cap and anonymized queries. This guide shows the data schema, the formulas to copy and a step-by-step build.
Want to go further? Ask
Quick quiz
Is SEO right for you, and how should you start?
Sorank matches your answers


Test it for 3 days on your own site and see where you stand on Google, ChatGPT and the other AIs.
Start 3-day free trial3 days free, then stop whenever you want. 90-day results guarantee, conditions apply.
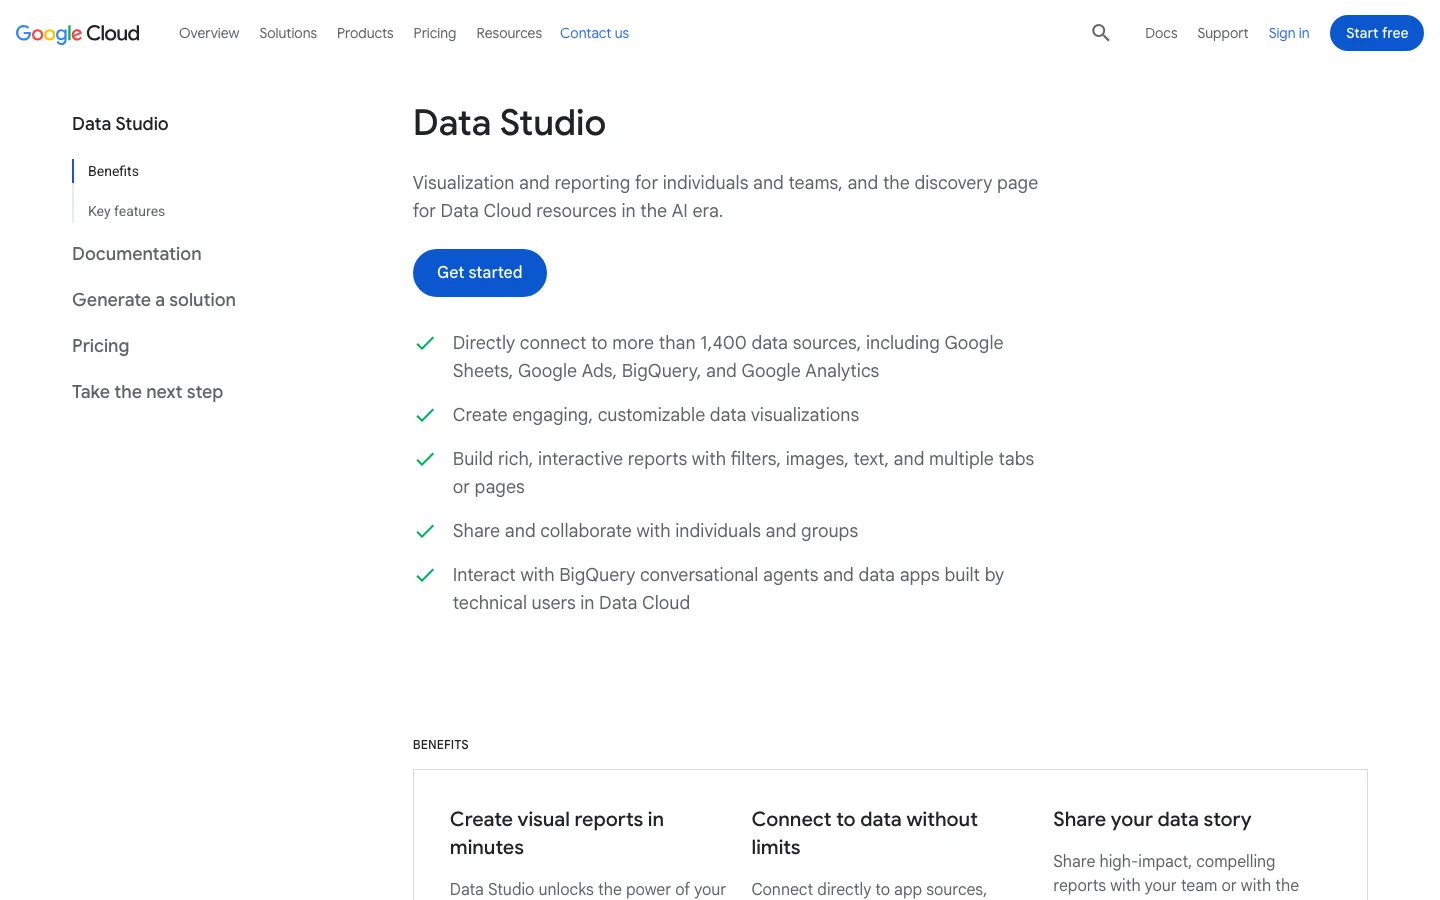
Looker Studio connects to a data source, lets you create fields on top of it, and draws charts that refresh every time someone opens the report. For SEO, that means no more monthly exports from Search Console pasted into a spreadsheet. You build the report once, and your boss, your client or your team open a link that always shows the latest numbers.
It costs nothing for the core product. A paid tier (Pro) adds team workspaces, more delivery schedules and support. Note a naming detail that confuses many people: in its current documentation, Google again labels the product "Data Studio", its name before 2022. The interface, the connectors and the address lookerstudio.google.com are the same, and "Looker Studio" is still what people type in Google.
Looker Studio does not create data. It shows what the connector sends, with the same limits. It does not track rankings on chosen keywords (Search Console gives an average position, not a daily position for a fixed list), does not crawl your site and does not tell you what to fix. If you want those, you need a crawler, a rank tracker, or a tool that reads the data and turns it into actions. Looker Studio is the window, not the engine.
For the general structure of an SEO report (what to show to whom), read our guide on SEO reporting. This article focuses on the technical side: the data, the formulas and the build.
There is more than one route from Search Console to a chart. The right one depends on your site's size and on how far back you need to look.
Principle: Google's own connector reads the Search Console API live. When to use it: small and medium sites, most client dashboards. Advantages: free, two minutes to set up, no code. Limits: the API's row cap, 16 months of history, and every chart triggers a live query, which slows heavy reports. Example: a local business with 300 pages and a few thousand queries a month gets everything it needs here.
Principle: reads the GA4 Data API for sessions, engagement and conversions. When to use it: always, alongside Search Console, because clicks are not business results. Advantages: any GA4 field is available, including custom dimensions. Limits: GA4 segments and comparisons are not available through the connector, and every chart spends API quota tokens. Example: conversions from organic landing pages.
Principle: Search Console writes a daily export of all its performance rows into a BigQuery dataset, and Looker Studio reads BigQuery. When to use it: large sites that hit the row cap, or anyone who needs history beyond 16 months. Advantages: no row cap per day, history that keeps growing from the day you activate it, SQL for any calculation. Limits: needs a Google Cloud project with billing, some SQL, and it only starts from the activation date (no backfill). Anonymized queries are still blank. Example: an online store with 40000 product pages.
Principle: you push data into a spreadsheet (by hand, with an add-on or a script) or pay a connector service, then connect that. When to use it: to add targets, budgets or data from tools without a Google connector (backlinks, rank tracking, AI visibility). Advantages: any source becomes chartable. Limits: spreadsheets get slow past a few hundred thousand cells, scripts break silently, paid connectors add a monthly cost.
| Method | Cost | Setup effort | Row cap | History | Best for |
|---|---|---|---|---|---|
| Native Search Console connector | Free | Minutes | API limit per day | 16 months | Most sites, client reports |
| Native GA4 connector | Free | Minutes | Quota tokens | Property retention | Sessions, conversions, AI referrals |
| BigQuery bulk export | Storage and query fees | Hours, some SQL | None per day | From activation, unlimited | Large sites, long history |
| Sheets or paid connector | Free to monthly fee | Variable | Sheet size | What you store | Targets, third-party tools |

When you add the Search Console connector, it asks you to pick a table: Site Impression or URL Impression. Most dashboards that "do not match Search Console" come from picking the wrong one. A single data source can only use one table, so if you need both, create two data sources and add them to the same report.
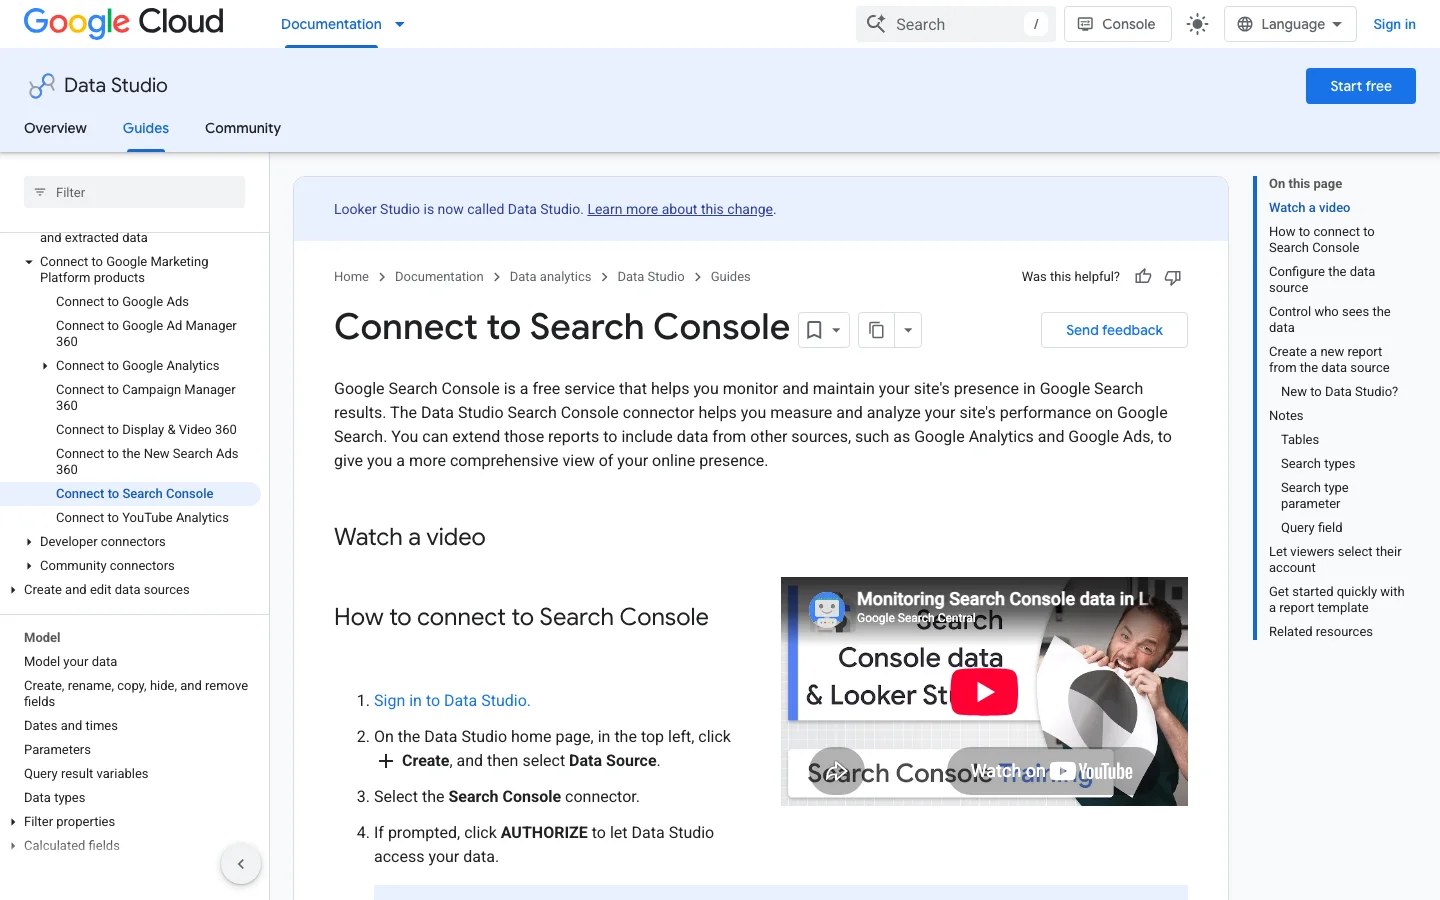
The difference is the aggregation. Google's help page "What are impressions, position, and clicks?" explains it with a knowledge panel showing five links to your site: grouped by property, that is one impression; grouped by page, that is five impressions, one per URL. Data is also attributed to the canonical URL Google picked, not necessarily the URL you see in the address bar.
Site Impression vs URL Impression table
The fields you will use most: in the Site table, Query, Clicks, Impressions, Site CTR and Average Position; in the URL table, Landing Page, Query, Url Clicks, Impressions, URL CTR and Average Position. Both add Date, Country, Device and a Search type parameter (web, image, video, news, plus discover and googleNews on the URL table). Add a drop-down control on that parameter so readers can switch between Web and Image without a second report.
For each query, Search Console keeps the topmost position your site reached, then averages across queries. Google's example: one query shows you at positions 2, 4 and 6 (counted as 2), another at 3, 5 and 9 (counted as 3), so the average is 2.5. Two consequences for your dashboard. First, a page that starts ranking for hundreds of new long-tail queries at position 40 makes the average "drop" while traffic rises. Second, never average averages yourself: a blended chart that re-averages Average Position across pages gives a number with no meaning. Always read position together with impressions.
Queries typed by very few people are hidden to protect privacy. In Looker Studio they appear as one row with an empty Query. In the Site table, chart totals still include them, so the sum of your query table is lower than the scorecard. Decide once: either keep them and label them "Anonymized", or filter them out with a filter "Exclude, Query, Is Null" and say so in a note on the page.
The Performance report in Google Search Console is already a dashboard. It shows clicks, impressions, CTR and average position for a date range you choose, with tabs for queries, pages, countries, devices and search appearance below the chart. Read it in that order: the trend first, then the comparison, then one segment at a time. Many questions from a monthly review can be answered there in a few minutes. You only need another tool when you want the same view every week without touching the filters. New to the menus? Our Google Search Console tutorial walks through each one.
Start with “Last 28 days” or a custom range, then tick Compare and pick the previous period or the same period last year. Seasonal sites should always compare with last year, because a December drop measured against November says little. Leave out the last two or three days when you read the trend. Search Console completes its most recent data late, so the end of the curve can look like a drop that never happened.
On the Pages or Queries tab, add a filter. For a directory, choose Page, then Contains, and type /blog-geo-seo/. For a pattern, choose Custom (regex) on the Query filter and try ^how|^what to isolate question queries. Keep patterns short. A pattern that matches nothing shows an empty table, so test it on a query you already know before you trust the result.
Web is the default search type. Switch to Image, Video, News, Discover or Google News to read each channel on its own. Discover clicks rarely come from the same queries as web results, so mixing them makes the query table hard to interpret. The Search appearance tab tells you whether clicks came from a result with an extra feature, such as a video. That helps when you explain a change to someone who only looks at totals.
| Question | Where to look | Watch for |
|---|---|---|
| Is traffic moving? | The chart with Compare on | Read clicks and impressions together |
| Which pages lost clicks? | Pages tab, sorted by the change column | Pages with few impressions swing by large percentages |
| Which queries are new? | Queries tab in compare mode | Long-tail queries can appear as new even when demand is flat |
| Did a country or device change? | Countries and Devices tabs | A small country can turn a tiny gain into a large percentage |
Move to another tool when you need a view shared with people who have no Search Console access, the same filtered view every Monday, or clicks next to GA4 sessions. Before you build any chart, check that the page appears in the report at all. A page missing from the Pages tab is usually a crawling or indexing problem, and a chart cannot fix that. Our guide to Google indexing covers those cases.
Looker Studio has three kinds of connectors: Google connectors for Google's own products, partner connectors for tools outside Google, and community connectors built by developers. For Search Console, Google Analytics, Google Ads or BigQuery, use the Google connector with the same name. For any other source, pick a partner connector if you can pay a monthly fee, or a community connector if you accept less support.
Each connector has caps that decide what you can trust. The Search Console connector stops at 50000 rows per day and search type. A partner connector may limit refreshes or rows on its plan, so read the plan before you add a large table. A community connector can fail without warning when the source changes its format. Build one test chart first, then compare its totals with the source's own interface. If they match, build the rest of the report.
| Data you need | Connector to use | Watch for |
|---|---|---|
| Search Console, GA4, Google Ads | Google connector | API quotas per property |
| Tools outside Google, such as backlinks or rank tracking | Partner connector, or a sheet fed by a script | Monthly plan cost and limits |
| A source with no connector | Community connector | One maintainer, format changes |
| Large Google data sets | BigQuery | Query cost, so always filter by date |
Tip
Prefer a connector that reads the source directly. A spreadsheet fed by a script adds one more point of failure, so keep it for data with no connector, such as targets or a manual list of pages.
For a fixed keyword list, our keyword ranking report guide shows how to present rank data next to Search Console. If you need an API to feed a custom source, compare the options in our SEO API comparison.
Every surprising number in an SEO dashboard comes from one of these limits. Put them in a note on the first page of your report, so nobody draws conclusions from an artifact.
The limits that shape your SEO dashboard
Sources: Google Search Central blog, Daniel Waisberg, 19/10/2022; Google Analytics Data API quotas; Looker Studio help on scheduled delivery
Daniel Waisberg (Google) detailed it in "A deep dive into Search Console performance data filtering and limits" (19 October 2022): the API returns up to 50000 rows per day, per site, per search type. Reports without query or URL dimensions (countries, devices) show all the data. Reports with Query and Landing Page together hit the cap first, because every page and query pair is one row. Signs you are capped: totals in a page and query table that stop growing while impressions keep rising, or long-tail pages missing. The fixes, from simplest to strongest: split the property into several URL-prefix properties (one per directory), filter by country, or switch to the BigQuery export.
Each GA4 chart is an API request that costs tokens. Google's Analytics Data API quota page sets 200000 core tokens per property per day, 40000 per hour, 14000 per project per property per hour and 10 concurrent requests for a standard property. A 12-page report with 15 charts per page, opened by five people at 9 a.m. on Monday, can show "quota exceeded" errors. Reduce charts per page, use a longer cache, or extract the data (Extract Data connector) for heavy pages. GA4 segments and comparisons do not pass through the connector: rebuild them with filters and calculated fields.
Search Console data is never real time, and the last days are often incomplete. Set the default date range to end a few days before today ("Last 28 days" excluding today is a good default) so the curve does not always end in a false drop. Looker Studio also caches query results: if numbers look stale, use "Refresh data" in the View menu before blaming the source.
Here is the method we recommend for a first dashboard that a marketing manager and an SEO expert can both use. Count two to three hours the first time.
Build an SEO dashboard in Looker Studio in 6 steps
Create a blank report, then Add data, Search Console, pick your property, choose Site Impression, Web. Repeat with URL Impression. Then add Google Analytics, pick the GA4 property. Rename each source clearly ("GSC Site", "GSC URL", "GA4") because you will select them in every chart. Prefer a Domain property in Search Console (sc-domain:example.com) so the data covers http, https and every subdomain.
Create fields in the data source (Resource, Manage added data sources, Edit, Add a field), not in each chart. A field created at the source is reusable everywhere and edited in one place. The formulas are in the next section.
Add a date range control at the top of the page and, in the report settings, a default range and a comparison period (previous period, or previous year for seasonal sites). Add drop-downs for Country and Device, and one for the Search type parameter. Place these controls on a theme layout so they appear on every page.
Four scorecards from GSC Site: Clicks, Impressions, Site CTR, Average Position, each with "Comparison date range" on so the reader sees the change in percent. Note: for Average Position, a lower number is better, so tick "Reverse color" on that scorecard or the drop will show in red. Then a time series of Clicks and Impressions on two axes, by week rather than by day so weekend dips do not hide the trend. Finish with one GA4 scorecard for organic conversions.
One question per page, one or two charts per question. The table in the "Dashboard layout" section below lists the pages we use. Keep tables to 10 to 25 rows with pagination, and add a CTR and position heatmap (conditional formatting) so outliers jump out.
See the dedicated section below on credentials and scheduled delivery: this is where most dashboards break three months after launch.
This is where Looker Studio beats the Search Console interface. All formulas below work in the native connector. One rule first: Google's REGEXP_MATCH documentation states that the function returns true only if the value matches the whole pattern, using the RE2 syntax. So REGEXP_MATCH(Query, 'brand') only matches the exact query "brand". Wrap your pattern in .* on both sides to match "brand" anywhere. Patterns with a backslash work best as raw strings, written r'...'.
Brand queries depend on your notoriety, non-brand queries on your SEO work. Mixing them hides the real progress. Replace the example names by your brand, its common typos and your product names.
CASE
  WHEN Query IS NULL THEN 'Anonymized'
  WHEN REGEXP_MATCH(Query, r'.*(acme|acmee|akme|acme shop|acmeshop).*') THEN 'Brand'
  ELSE 'Non-brand'
END
Search Console queries are lowercase, but if you add data from another source, make the match case insensitive with the RE2 flag:
REGEXP_MATCH(Query, r'(?i).*(acme|akme).*')Tip
Building a complete brand list (misspellings, product names, founder names) is a job in itself. Our guide on branded keywords gives the method and the warning signs of a brand regex that is too wide.
On the URL table, Landing Page is a full address. This field extracts the first folder, so /blog/, /product/ and /category/ become comparable groups. The home page gets its own label.
CASE
  WHEN REGEXP_MATCH(Landing Page, r'^https?://[^/]+/?$') THEN 'Home'
  ELSE REGEXP_EXTRACT(Landing Page, r'^https?://[^/]+/([^/?#]+)')
END
For the second level (useful for /blog/category/ or /fr/blog/ on multilingual sites):
REGEXP_EXTRACT(Landing Page, r'^https?://[^/]+/[^/]+/([^/?#]+)')Limit to keep in mind: single-level pages such as /pricing become their own "directory". If your site has many of them, use the page-type field below instead.
When the folder structure does not match your business (product pages at the root, for example), map patterns to types by hand. The order matters: the first true condition wins.
CASE
  WHEN REGEXP_MATCH(Landing Page, r'.*/blog/.*') THEN 'Article'
  WHEN REGEXP_MATCH(Landing Page, r'.*/(product|p)/.*') THEN 'Product'
  WHEN REGEXP_MATCH(Landing Page, r'.*/(category|c|collections)/.*') THEN 'Category'
  WHEN REGEXP_MATCH(Landing Page, r'.*/(pricing|contact|demo).*') THEN 'Conversion page'
  ELSE 'Other'
END
Question queries show what people want to learn, and they are the same kind of questions people ask AI assistants. Isolating them gives you a list of FAQ and article topics.
CASE
  WHEN REGEXP_MATCH(Query, r'^(how|what|why|when|where|which|who|can|does|do|is|are|should|will) .*') THEN 'Question'
  ELSE 'Other'
ENDNumber of words in a query, to separate short head terms from the long tail:
LENGTH(Query) - LENGTH(REPLACE(Query, ' ', '')) + 1Then a bucket from that field (create it after the word count field, named Query words):
CASE
  WHEN Query words >= 5 THEN '5+ words'
  WHEN Query words >= 3 THEN '3-4 words'
  ELSE '1-2 words'
END
A rough intent label from modifiers. It will not be perfect, but it shows whether your growth comes from people ready to buy or from people reading:
CASE
  WHEN REGEXP_MATCH(Query, r'.*\b(price|pricing|buy|cost|cheap|discount|quote|order)\b.*') THEN 'Transactional'
  WHEN REGEXP_MATCH(Query, r'.*\b(best|top|vs|review|reviews|alternative|alternatives|comparison)\b.*') THEN 'Commercial'
  WHEN REGEXP_MATCH(Query, r'^(how|what|why|when|where|which|who) .*') THEN 'Informational'
  ELSE 'Unclassified'
ENDThe CTR field of the connector is pre-calculated. As soon as you group rows in your own way, recompute it from the sums, or the chart will average row-level CTRs:
SUM(Url Clicks) / SUM(Impressions)Set the field type to Percent. To judge whether a CTR is low for its position, compare with typical values in our CTR calculator.
Search Console stops at the click; GA4 starts at the visit. Joining them by landing page shows, for each page, impressions, clicks, sessions and conversions in one row. The difference between the two tools is explained in our article Google Analytics vs Search Console.
One landing page, two tools, four steps
GSC gives a full URL (https://www.example.com/blog/post/), GA4 gives a path with parameters (/blog/post/?utm_source=x). They will never join as they are. Create a clean path on each side.
On the GSC URL source:
REGEXP_REPLACE(REGEXP_REPLACE(Landing Page, r'^https?://[^/]+', ''), r'[?#].*$', '')On the GA4 source (dimension "Landing page + query string"):
REGEXP_REPLACE(Landing page + query string, r'[?#].*$', '')If your site mixes trailing slashes, normalize them too by removing the final slash on both sides, except for the home page.
Resource, Manage blends, Add a blend. Left table: GSC URL with the clean path, Url Clicks and Impressions. Right table: GA4 with the clean path, Sessions and Key events, filtered on Session default channel group equals Organic Search. Join type: left outer, so pages with clicks but no tracked sessions stay visible (they often reveal a tracking problem). Do not put Query in the blend: GA4 has no query, and the join would multiply rows.
Clicks and sessions will never be equal: a click can bounce before the tag fires, consent banners block tracking, and one session can include several clicks. A steady gap is normal and not a bug. Watch the trend of the ratio, not its value. And leave Average Position out of blended charts, since the blend re-aggregates it in a way that has no meaning.
Visits from AI assistants land in GA4 as referrals, mixed with every other site that links to you. A calculated field separates them so your SEO dashboard shows Google and AI side by side. Create it on the GA4 data source:
CASE
  WHEN REGEXP_MATCH(Session source, r'.*(chatgpt\.com|chat\.openai\.com|perplexity\.ai|claude\.ai|gemini\.google\.com|copilot\.microsoft\.com|grok\.com|chat\.deepseek\.com|chat\.mistral\.ai|meta\.ai).*') THEN 'AI assistants'
  ELSE Session default channel group
END
Use this field instead of the default channel group in your acquisition charts. To see which assistant sends what, a second field keeps the source name:
CASE
  WHEN REGEXP_MATCH(Session source, r'.*(chatgpt|openai).*') THEN 'ChatGPT'
  WHEN REGEXP_MATCH(Session source, r'.*perplexity.*') THEN 'Perplexity'
  WHEN REGEXP_MATCH(Session source, r'.*claude\.ai.*') THEN 'Claude'
  WHEN REGEXP_MATCH(Session source, r'.*gemini\.google.*') THEN 'Gemini'
  WHEN REGEXP_MATCH(Session source, r'.*copilot\.microsoft.*') THEN 'Copilot'
  ELSE 'Other'
END
Pair it with Landing page to know which pages AI assistants send people to. Those pages are usually the ones they cite. Limits: some apps do not pass a referrer, so part of AI traffic falls into Direct, and the list of domains changes as new assistants launch, so check it every quarter. The full GA4 method, with explorations, is in our guide to measuring visits from AI with Google Analytics.
Tip
Once you know your monthly AI sessions, our free AI traffic value calculator estimates what that traffic is worth compared with paid clicks.
If you would rather not maintain these formulas, Sorank's GEO / SEO dashboard connects Search Console and Analytics, isolates visits from AI assistants and sorts pages into growing, declining and lost, for Google and AI traffic in one view.
A good SEO dashboard answers questions, it does not display every metric. Here is the layout we use, page by page. Copy it as a specification, then build each page with the fields above.
| Page | Question it answers | Charts | Data source |
|---|---|---|---|
| Overview | Is organic search growing? | 4 scorecards with comparison, weekly time series | GSC Site, GA4 |
| Brand vs non-brand | Does growth come from SEO or from notoriety? | Stacked area by Brand field, table of top non-brand queries | GSC Site |
| Queries | Which queries win or lose clicks? | Table with comparison and change column, filter on Question field | GSC Site |
| Pages and directories | Which sections of the site perform? | Bar chart by directory, page table with CTR heatmap | GSC URL |
| Opportunities | Where is the quickest gain? | Table filtered on position 4 to 20 and high impressions | GSC URL |
| Conversions | Which organic pages bring business? | Blended table: clicks, sessions, key events per page | Blend GSC URL and GA4 |
| AI traffic | How much do AI assistants send, and to which pages? | Time series by assistant, landing page table | GA4 |
This page often brings the most value for the least effort. Table on GSC URL with Landing Page and Query as dimensions, Impressions, Url Clicks, recomputed CTR and Average Position as metrics. Add two filters: Average Position between 4 and 20, and Impressions greater than a threshold that fits your site (100 for a small site, 1000 for a large one). Sort by impressions. Each row is a page that Google already considers relevant and that a content update could lift to the top 3. Our guide on content refresh explains what to change on those pages.
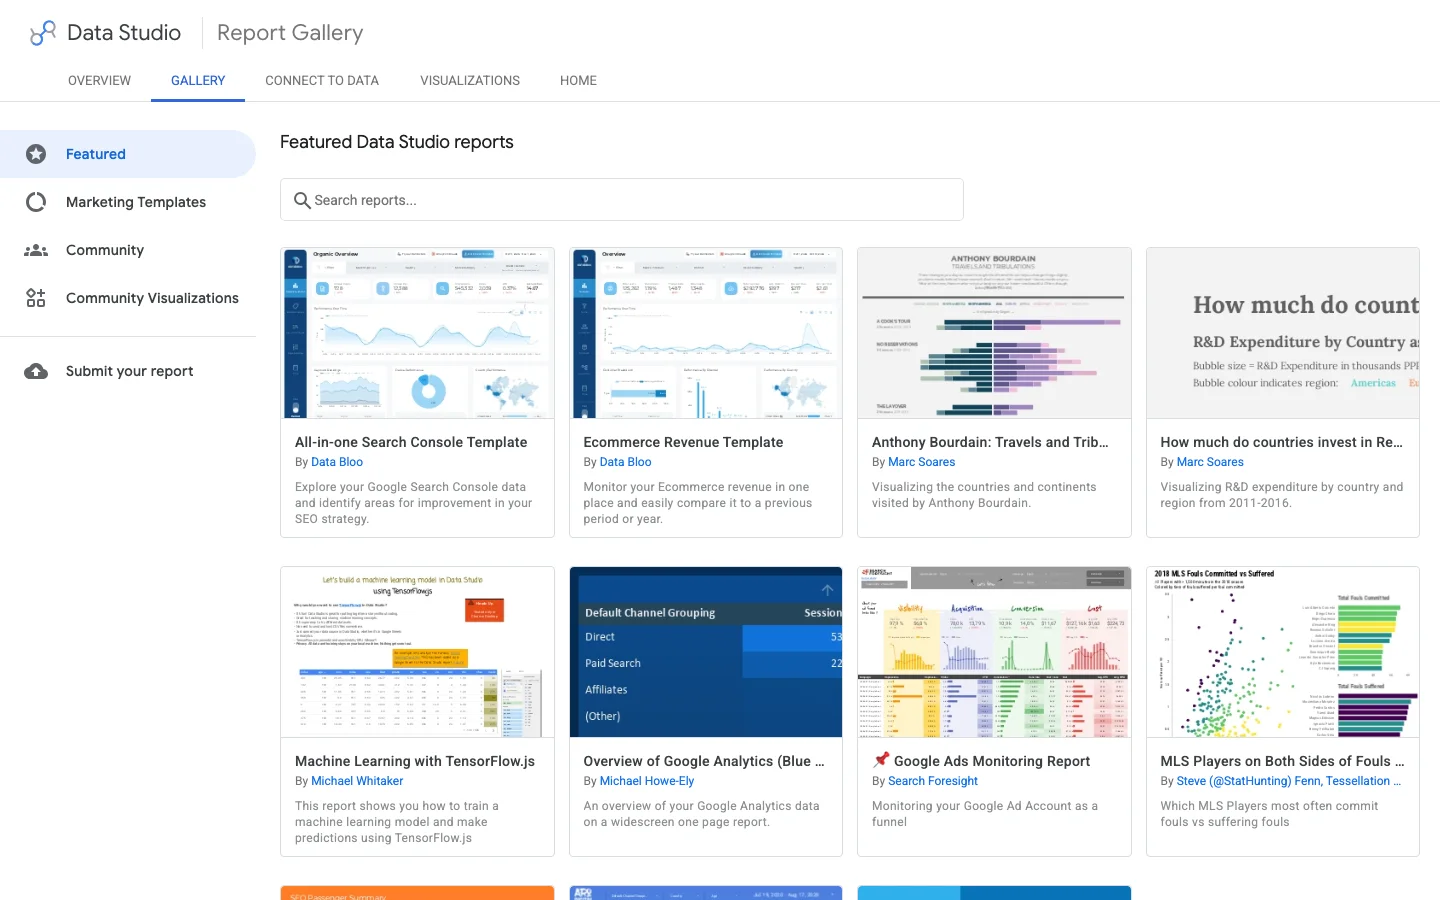
Google's report gallery lists featured reports, marketing templates and reports built by the community. A template saves layout time, but check three things before using one: which table it connects to (Site or URL), whether its calculated fields use a brand regex you must edit, and whether it depends on a paid connector. When you click "Use template", Looker Studio asks you to replace its data sources with yours: map each one carefully, or charts will show "configuration error".
For agencies, the most effective setup is one master report built on your own site, then "Make a copy" per client and swap the data sources. The calculated fields come along, only the brand regex changes.
The report is built. Two settings decide whether it still works in six months.
Each data source has a credentials setting. "Owner's credentials" means the report reads the data with your access: viewers see the numbers without having access to Search Console. "Viewer's credentials" means each reader must have their own access to the property. For a client or a manager, use the owner's credentials. The trap: if the owner leaves the company or loses access to the property, every chart breaks. Use a shared account that belongs to the company, or transfer ownership before someone leaves.
Share in view mode by default. Give edit rights only to people who build, because an editor can change a data source used by ten charts. Disable "Download" and "Copy" in the sharing options if the report contains revenue figures.
Share, Schedule delivery sends a PDF of the report with a link to the live version. The rules, from Google's help page on scheduling automatic report delivery: on the free version, one schedule per report and at most one send per day; up to 50 additional recipients; individual accounts can send 200 emails per day and 800 per month, Google Workspace accounts 500 and 3000. Pro allows up to 200 schedules per report, sending up to once an hour, with a custom subject and message.
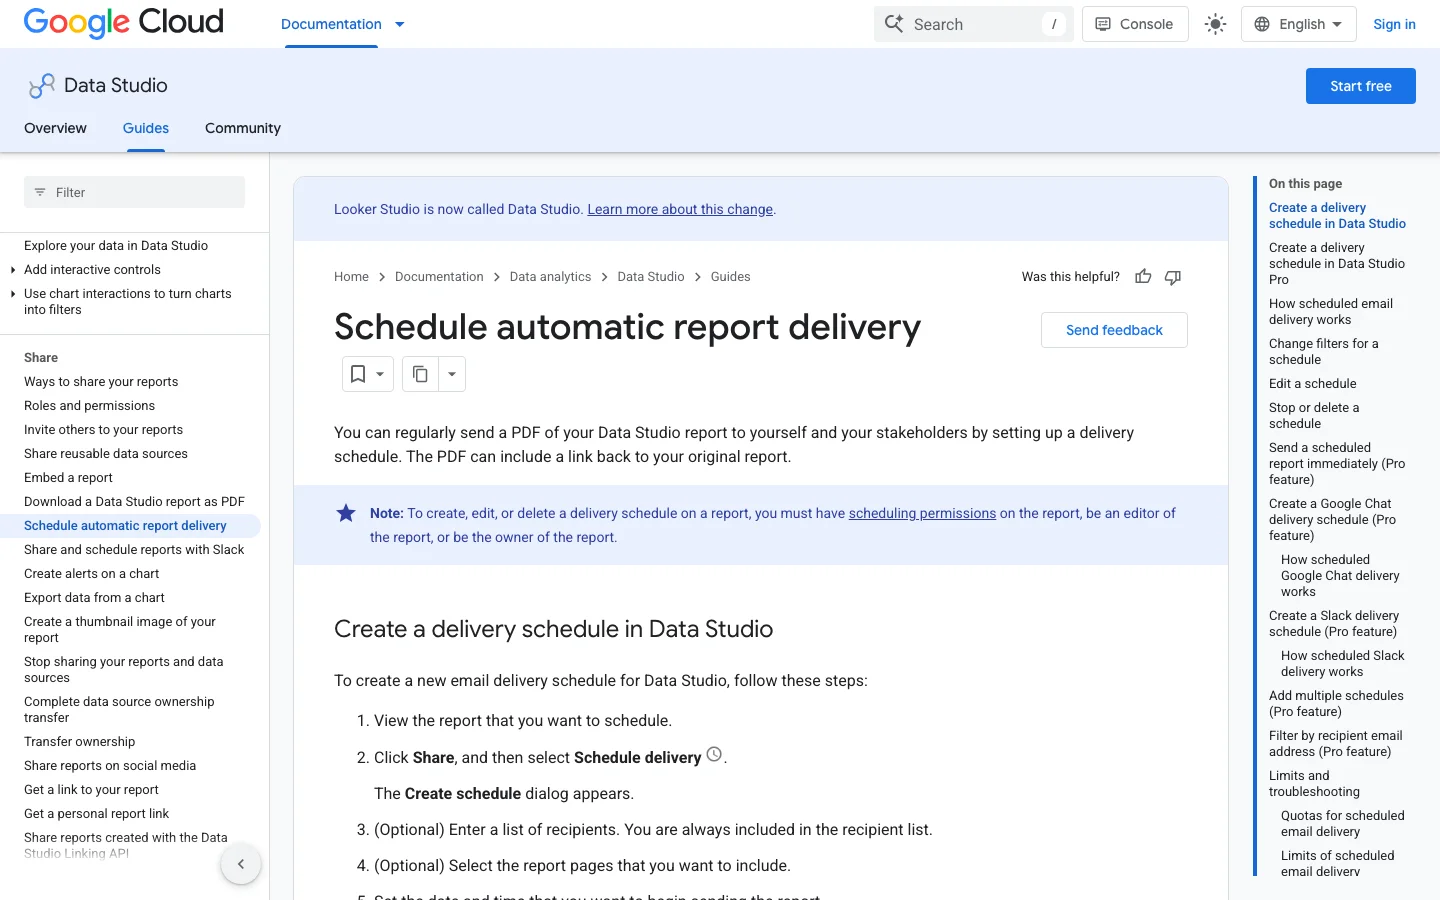
Practical advice: send weekly, on Monday morning, with the date range set to "Last 7 days" compared with the previous period. If you need different PDFs for different people on the free version, make a copy of the report per audience. For automating the whole reporting chain, see our guide on automated SEO reporting.
What it is: building the pages view on Site Impression, which has no landing page. How to spot it: the Landing Page field is missing from the field list, or someone used Query as a proxy. How to fix it: add a second data source on URL Impression and switch page charts to it.
What it is: showing the URL table's impressions as "site impressions". How to spot it: the total is higher than the Search Console default view. How to fix it: take headline totals from the Site table, and use the URL table only for distributions between pages.
What it is: the brand filter matches almost nothing, because the function needs a full match. How to spot it: brand clicks are near zero while your name ranks first. How to fix it: write r'.*(brand).*', then test the field in a table next to Query.
What it is: the chart applies "Average" to a ratio. How to spot it: CTR in a grouped table differs from Clicks divided by Impressions. How to fix it: recompute CTR with SUM()/SUM(), and never show Average Position in blends or re-grouped tables.
What it is: totals of the query table lower than the scorecard, and an empty first row. How to spot it: a row with no query and many impressions. How to fix it: label it "Anonymized" with the CASE above, or filter it out and write a note explaining the gap.
What it is: a large site whose page and query table is truncated. How to spot it: the long tail looks too short, or page totals stop growing while impressions rise. How to fix it: split by URL-prefix properties, narrow by country, or move to the BigQuery export.
What it is: data sources running on the personal credentials of an employee or a freelancer. How to spot it: in the data source, the credentials name a person, not a company account. How to fix it: transfer ownership to a company account and reconnect the sources with it.
What it is: 20 charts that each query the APIs. How to spot it: slow loading, GA4 quota errors at peak hours. How to fix it: one question per page, eight charts maximum, extracts for heavy GA4 pages.
The same dashboard, before and after the fixes
An SEO agency dashboard works best as one master report that you copy for each client. The master holds the pages, charts and calculated fields. Each copy points to that client's Search Console and GA4 sources and uses that client's brand list. Your metrics stay identical across accounts, and a new client mainly needs new data sources and a new brand regex.
Build the master on a property you know well, and keep every calculated field at the data source level, as described above, so each copy inherits them. Use a placeholder in the brand regex, such as acme, and a generic report title. When you copy the report, rename it with the client's name, so a reader knows at a glance which account they are viewing.
Do not put two clients in the same report, even on separate pages. Anyone with access sees every chart, and one wrong data source can mix two sites' numbers into one total. Google's guide to team workspaces uses the same logic, with the example of a workspace dedicated to one client's campaign. Team workspaces belong to the paid Pro tier. Without it, a separate copy per client does the same job.
Share each copy with the client's contacts in view mode. Set the data credentials to the agency's company account, not to a team member, so the charts keep working when someone leaves. That account also needs a Search Console role that can view performance data for the client's property. Without it, the connector returns errors or empty charts, and the client sees a broken report even though the design is fine.
On the free version, a report gets one scheduled delivery, so each client copy needs its own schedule. Send the weekly PDF on the same day for every client, so the reporting rhythm stays predictable. For the wider method, see our agency guide and our guide on SEO reporting. If you also track rankings for each client, compare options in our guide to white label rank trackers, which removes one more manual export.
Before you share a client copy
When the native connector reaches its limits, activate the bulk data export in Search Console settings. It creates a dataset (named searchconsole by default) with two main tables, searchdata_site_impression and searchdata_url_impression, the same two aggregations as the connector. Each row holds clicks, impressions and sum_top_position, a zero-based sum of the top position per impression. So the average position is computed like this:
SELECT
  query,
  SUM(clicks) AS clicks,
  SUM(impressions) AS impressions,
  SAFE_DIVIDE(SUM(clicks), SUM(impressions)) AS ctr,
  SAFE_DIVIDE(SUM(sum_top_position), SUM(impressions)) + 1 AS avg_position
FROM `your-project.searchconsole.searchdata_site_impression`
WHERE data_date BETWEEN DATE_SUB(CURRENT_DATE(), INTERVAL 31 DAY) AND DATE_SUB(CURRENT_DATE(), INTERVAL 3 DAY)
  AND search_type = 'WEB'
  AND NOT is_anonymized_query
GROUP BY query
ORDER BY clicks DESC
In Looker Studio, connect BigQuery with a custom query like this one rather than the raw table, and always filter on data_date: the tables are partitioned by date, and a query without a date filter scans and bills the whole history. Keep the native connector for small charts and use BigQuery for the heavy tables. For which metrics deserve a place in the final report, our list of SEO KPIs sorts them by stage.
Run through this list each time you deliver a new dashboard or a copy for a client. It takes ten minutes and avoids the questions that ruin trust in a report.
Looker Studio SEO dashboard checklist
What to do today: create the two Search Console data sources, add the brand field, and build only the overview page and the opportunities table. That is one hour of work, and the opportunities table alone will give you a list of pages to update this week. If you track keyword positions on a fixed list as well, our guide to the keyword ranking report shows how to present them next to Search Console data.
Yes. The core product, including the native Search Console and Google Analytics 4 connectors, is free. The paid Pro version adds team workspaces, more delivery schedules per report and support, but a complete SEO dashboard works on the free version.
The most common cause is the table: the URL Impression table counts one impression per URL per query, so its totals are higher than the property view. Anonymized queries, the 50000-row daily limit of the API and incomplete recent days also explain gaps. Take headline totals from the Site Impression table and end your date range a few days before today.
Create a calculated field with CASE and REGEXP_MATCH on the Query field, listing your brand name, its typos and your product names. REGEXP_MATCH needs a full match, so wrap the pattern in .* on both sides, for example r'.*(acme|akme).*'. Then use the field as a dimension or a filter in every query chart.
We analyse your competitors, your website and your AI visibility to create a tailored content plan for free.
 AI Content Brief Generator
 FAQ Schema Generator
 AI Blog Post Ideas Generator
 Structured Data Validator (Schema Validator)
 Alt Text Checker
 Internal Link Analyzer
 Backlink Challenge
 AI Meta Description Generator
 AI Blog Title Generator
 Google Indexability Checker
 AI Blog Outline Generator
 UTM Link Builder
 Keyword Clustering Tool
 Canonical Tag Checker
 XML Sitemap Generator
 Broken Link Checker
 AI SEO Title Generator
 Headline Analyzer
 SERP Preview Tool
 Redirect Checker
 Hreflang Tag Generator
 Heading Structure Analyzer
 HTTP Headers Checker
 Favicon Extractor
 SERP CTR Calculator
 SEO vs Paid Search Savings Calculator
 SEO Share of Voice Calculator
 SEO ROI Calculator
 SEO Traffic and Revenue Forecast Calculator
 SEO Budget Calculator
 SEO Break-Even Calculator
 SaaS SEO ROI Calculator
 ROAS Calculator
 Reading Time Calculator
 Ranking Gain Simulator
 Organic Traffic Value Calculator
 Organic Traffic Estimator and Website Traffic Checker
 LTV to CAC Ratio Calculator
 Local SEO ROI Calculator
 Link Building Cost Calculator
 Keyword Value Calculator
 Keyword Opportunity Score Calculator
 Keyword Density Calculator
 GEO ROI Calculator
 GEO Content Investment Calculator
 Ecommerce SEO ROI Calculator
 Customer Lifetime Value Calculator
 Customer Acquisition Cost Calculator
 CTR Calculator
 Cost Per Article Calculator
 Conversion Rate Calculator
 Content Marketing ROI Calculator
 ChatGPT Referral Traffic Estimator
 Bounce Rate Calculator
 Backlink ROI Calculator
 AI Visibility Score Calculator
 AI Traffic Value Calculator
 AI Share of Voice Calculator
 Cost of AI Invisibility Calculator
 AI Citation Rate Calculator
 llms.txt Validator
 AI Overview Checker and AI Overviews Rank Checker
 Robots.txt Checker
 AI SEO Audit
 LLM Readability Checker
 SearchGPT Readiness Checker
 Structured Data LLM Audit
 Website Crawlability AI Audit
 Why ChatGPT Is Not Recommending My Website
 Gemini Ranking Tool
 Perplexity Ranking Checker
 LLM Citation Checker
 Answer Engine Optimization Audit
 GEO Audit
 AI Search Visibility Test
 ChatGPT Visibility Checker
 llms.txt Generator
 URL Extractor
 Webpage to Markdown
 Sitemap Checker
 SERP Volatility Sensor
 Page Size Checker
 Word Counter
 Slug Generator
 Schema Generator
 Robots Generator
 OG Preview
 Meta Tags Generator
 Image Compressor
 Favicon Generator
 On-Page SEO Audit: SEO Checker and SEO Analyzer
 Backlink Analysis Tool
 Keyword Research Tool
 Domain Authority Checker
 “I tested Sorank on a real client site and it's insane. It does everything an agency would bill you $1500 a month for. It's going into production on that client now.”

 Guillaume Guersanguersanguillaume.com“We are an Ads agency and we wanted to get our SEO back on track once and for all. Sorank gave us a clear view of our site, helped us prioritize optimizations, and properly structure our content. The tool is easy to use, well designed for a team, and very practical for centralizing tracking without having to juggle multiple platforms. A very solid foundation to start fresh with our SEO.”
 Gaspard MadouiAds Agency
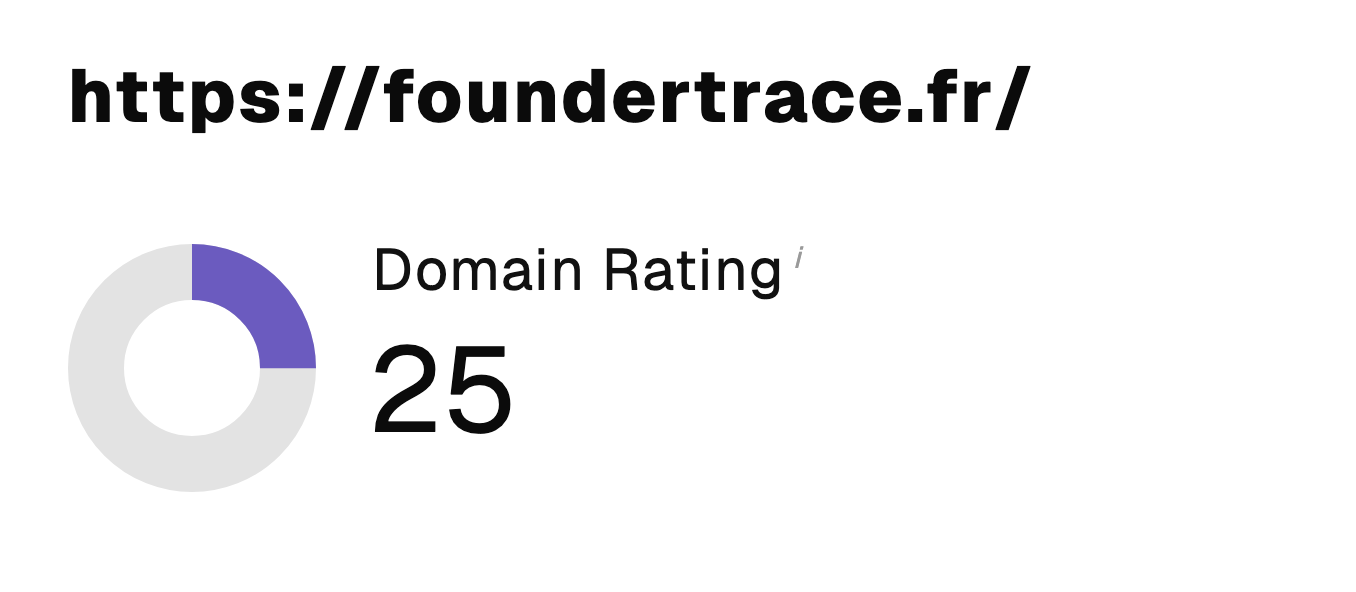 “I just let the Sorank software do its thing, and now my DR is 25 and my page is ranking higher.”
 Lucas Flandrefoundertrace.fr“I specialized in GEO thanks to Sorank. The GEO Leaderboard allows me to show my clients their position vs competitors on ChatGPT. It’s a real commercial differentiator.”
 MélanieSEO Freelance“Great service, works well for our website and helps us understand how to improve it to rank better on Google and elsewhere. Congrats, keep going, I recommend it.”
 Hugo T.E-commerce merchant