Preferences
Privacy is important to us, so you have the option of disabling certain types of storage that may not be necessary for the basic functioning of the website. Blocking categories may impact your experience on the website. More information

Privacy is important to us, so you have the option of disabling certain types of storage that may not be necessary for the basic functioning of the website. Blocking categories may impact your experience on the website. More information

Data-driven SEO in 2026: which data to read (Search Console, logs, SERP, AI answers), the decision rules that follow, and a one-page dashboard.

Tools

In short
data-driven SEO means every optimization decision starts from a measured signal instead of a hunch. Four sources cover almost everything: Google Search Console (what Google shows and what people click), server logs (what robots crawl), the results pages themselves (who ranks and why), and AI answers (whether ChatGPT, Gemini or Perplexity cite you). Each signal is tied to a decision rule, such as refreshing a page whose clicks fall for two months, and the results are read on one dashboard every week.
Want to go further? Ask
Quick quiz
Is SEO right for you, and how should you start?
Sorank matches your answers


Test it for 3 days on your own site and see where you stand on Google, ChatGPT and the other AIs.
Start 3-day free trial3 days free, then stop whenever you want. 90-day results-or-refund guarantee.
Most SEO teams already collect plenty of data. What they lack is the link between a number and an action. Data-driven SEO closes that gap: you choose a small set of sources, you write in advance what each signal triggers, and you check after the fact whether the change worked. The approach comes from data-driven marketing, applied to organic search, and since Google confirmed that AI Overviews and AI Mode traffic is counted in the Search Console Performance report ("Web" search type), part of your AI exposure now sits in the same data as the rest of your SEO.
Data-driven SEO is a working method in which keywords, content, technical fixes and links are prioritized from measured evidence, then evaluated against a baseline. It replaces three common habits: following a generic checklist, copying what a competitor did, and judging a change by how it feels a week later.
The method rests on a simple loop:
The difference with traditional SEO lies in the last two steps. Without a dated change log and a baseline, you cannot tell whether a gain came from your work, from a Google update or from seasonality.
Each source answers one question and is blind to the others. The table below shows what to read in each one and where it stops.
| Source | Question it answers | Key metrics | Blind spot |
|---|---|---|---|
| Google Search Console | How does Google show my pages, and do people click? | Clicks, impressions, CTR, average position, indexing status | Nothing after the click; some queries are anonymized |
| Google Analytics 4 | What do visitors do once on the site? | Sessions by channel, engagement, conversions, AI referrals | Nothing before the click; consent banners hide part of the visits |
| Server logs | What do Googlebot and AI crawlers fetch? | Hits per robot, status codes, crawl frequency per section | Says nothing about rankings or clicks |
| Results pages (SERP) | Who ranks, with what format? | Top 10 page types, features (AI Overview, videos, local pack), word counts | A snapshot, personalized by location and device |
| AI answers | Am I cited by ChatGPT, Gemini, Perplexity, Claude? | Mention rate per prompt, cited sources, competitors cited | Answers vary between runs; needs repeated sampling |
| Crawl of your own site | What is broken or thin on my side? | Errors, redirects, duplicate titles, orphan pages, depth | Shows problems, not their business impact |
This is the most reliable source for organic performance because it comes from Google itself. The Performance report gives four metrics: clicks, impressions, CTR (clicks divided by impressions) and average position of your topmost result. The newest days are preliminary and can still change, so never judge a change on the last 48 hours. The interface keeps 16 months of history: if you want longer comparisons or raw rows, Google's bulk data export sends a daily copy to BigQuery, with all performance data except anonymized queries. For the basics of the tool, see our Search Console definition.
Analytics picks up where Search Console stops: engagement, conversions and revenue per landing page. It is also where visits from ChatGPT, Perplexity or Gemini appear, as referrals, once you group them into their own channel. Our guide to Google Analytics for SEO explains the reports to set up, and the definition of AI-referred traffic covers what can and cannot be measured.
Logs are the only source that shows what robots do on your site, request by request. They reveal sections Googlebot ignores, URLs that waste crawl budget (filters, parameters, old redirects), and how often GPTBot, ClaudeBot or PerplexityBot visit. Before trusting a line labeled Googlebot, verify it: Google documents a reverse then forward DNS check, or a comparison with its published IP ranges, because many scrapers fake the user agent. Our page on AI crawler logs lists the user agents to filter.
Search Console tells you your position, not why the page above you wins. A SERP analysis of the top 10 shows the dominant format (guide, list, tool, product page), the features that take space and the depth of the competing pages. AI answers need the same treatment: a fixed list of buyer questions, asked every week, with the brands and sources cited each time.
Tip
Start with Search Console and Analytics only. Add logs when your site passes a few thousand URLs, and AI tracking when buyers in your market ask ChatGPT or Perplexity before they search Google.
A data-driven approach works with a short list of metrics. Track the ones that lead to a decision, and keep the rest for diagnosis. Our list of SEO KPIs goes into detail; the short version:
Three metrics mislead when read alone. Average position for a whole site mixes thousands of queries, so it drops mechanically when you start ranking for new long-tail terms. Site-wide CTR falls when impressions grow faster than clicks, which is often good news. And raw traffic hides the fact that clicks are shrinking on queries where an AI summary appears: in a Pew Research Center study of 900 US adults (browsing data from March 2025), users clicked a traditional result on 8% of visits with an AI summary, against 15% without one. When clicks fall while impressions and positions hold, look at the results page first: the cause is often there.
The core of data-driven SEO is a short table of rules, written before you look at the numbers. It prevents both overreaction (rewriting a page after a two-day dip) and paralysis (watching a decline for six months). Here are rules that work on most sites; adjust the thresholds to your volume.
| Signal | Where you see it | Decision |
|---|---|---|
| Position 5 to 15, high impressions | Search Console, queries per page | Optimize title and H1 for the query, add the missing section, add internal links from strong pages |
| Position 1 to 3, CTR well below similar pages | Search Console | Rewrite title and meta description; check whether an AI Overview or other feature takes the space |
| Clicks down for two consecutive months, position stable | Search Console, page comparison | Check the results page for new features; update the content and the date if it has aged |
| Clicks and position down together | Search Console | Compare with the new top 3, refresh or merge the page |
| Two of your pages alternate on the same query | Search Console, query to page view | Merge them or differentiate their intent, then redirect |
| Page not crawled for weeks | Server logs | Add internal links, remove it from crawl traps, check the sitemap |
| Many hits on parameter or filter URLs | Server logs | Block or canonicalize the parameters |
| Competitors cited by AI on a prompt, you are absent | AI answer tracking | Publish or improve the page answering that question, get mentioned on the sources AI cites |
| High traffic, no conversions | Analytics | Check intent match, add a relevant call to action or internal link to a commercial page |
Declining pages deserve special attention because content decay is slow and silent. A content refresh based on the queries a page is losing usually recovers more traffic, faster, than a new article.
Watch out
Change one thing at a time on a given page and write down the date. If you rewrite the title, the content and the internal links in the same week, the data will never tell you which change worked.
A useful dashboard fits on one screen and answers three questions: are we growing, where, and what should we do next? Organize it in four blocks.
Read it weekly for movers and health, monthly for trends, and quarterly to revise your decision rules and keyword targets. Keyword targets come from the same logic: start from queries that already generate impressions, then use keyword research to find the neighboring topics you do not cover yet.
Generative engines add a layer that Search Console only partly sees. AI Overviews and AI Mode are counted in the Web search type, but nothing tells you whether you were cited in the answer or simply listed. ChatGPT, Claude and Perplexity do not report to you at all. The data-driven answer is the same as for SEO: a fixed panel of prompts that buyers ask, checked on a schedule, with three numbers per prompt (are you cited, which sources are cited, which competitors appear). Our ChatGPT citation study shows which kinds of sources these answers draw from, which tells you where to earn mentions.
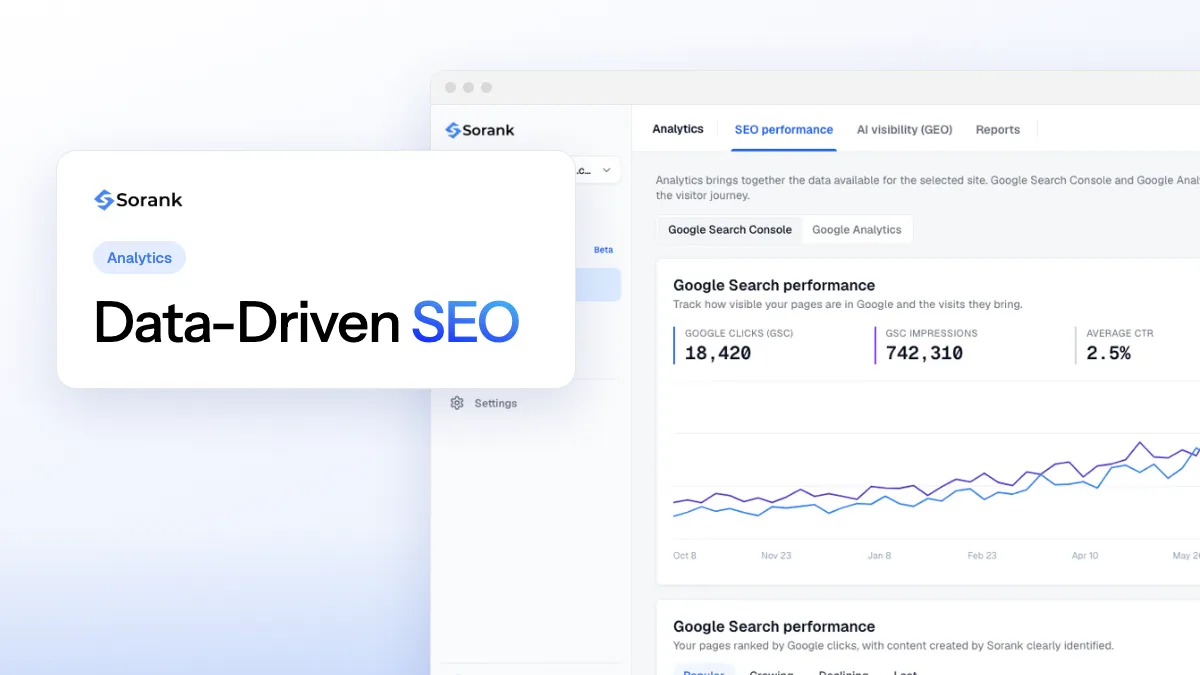
Sorank, our software, puts these sources in one place. Its GEO / SEO dashboard connects to Search Console and Google Analytics, shows clicks, impressions, CTR and position next to the visits sent by ChatGPT, Claude, Gemini, Perplexity and Grok, and sorts your pages into Popular, Growing, Declining and Lost. Its AI mention tracking checks 10 to 50 prompts every month, depending on the plan, and shows who is cited in your place.
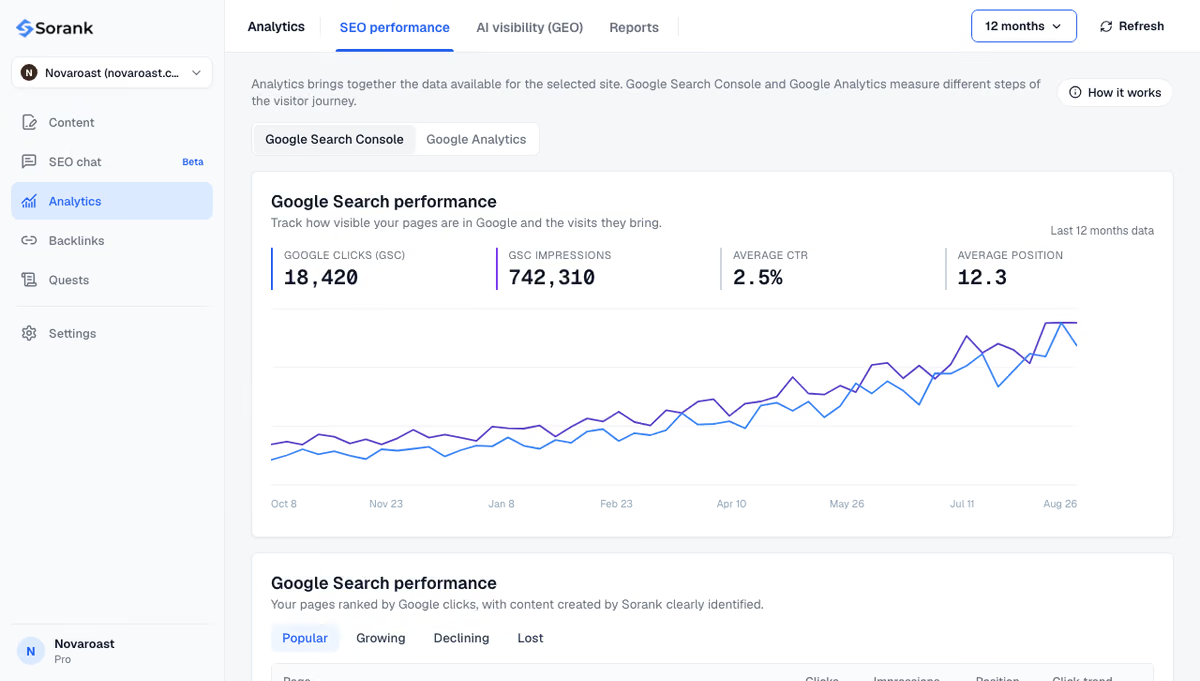
Begin with one source and one rule: open Search Console, filter the last three months, list the pages at positions 5 to 15 with the most impressions, and improve the top five. Note the date, wait six weeks, compare. That single loop is already data-driven SEO: a measured signal, a rule written in advance, and a check against a baseline. Add logs, results pages and AI answers once the habit is in place, or let the Sorank dashboard gather them for you.

Traditional SEO often follows checklists and experience, then looks at results afterwards. Data-driven SEO sets a baseline first, ties each signal to a decision rule written in advance, and checks every change against that baseline. Both use the same techniques; the difference lies in how priorities are chosen and how results are verified.
Google Search Console and Google Analytics, both free, cover most needs. A crawler such as Screaming Frog helps for technical checks, and server log access becomes useful on large sites. To follow AI answers, you need either a manual prompt panel checked every week or a tool that tracks brand mentions in ChatGPT, Gemini and Perplexity.
Wait until Google has recrawled the page and rankings have settled, usually four to eight weeks for an established page. Compare the same number of days before and after the change, and exclude the last two days of Search Console data, which are still preliminary. For new pages, watch impressions first, since they rise before clicks.
We analyse your competitors, your website and your AI visibility to create a tailored content plan for free.
 AI Content Brief Generator
 FAQ Schema Generator
 AI Blog Post Ideas Generator
 Structured Data Validator (Schema Validator)
 Alt Text Checker
 Internal Link Analyzer
 Backlink Challenge
 AI Meta Description Generator
 AI Blog Title Generator
 Google Indexability Checker
 AI Blog Outline Generator
 UTM Link Builder
 Keyword Clustering Tool
 Canonical Tag Checker
 XML Sitemap Generator
 Broken Link Checker
 AI SEO Title Generator
 Headline Analyzer
 SERP Preview Tool
 Redirect Checker
 Hreflang Tag Generator
 Heading Structure Analyzer
 HTTP Headers Checker
 Favicon Extractor
 SERP CTR Calculator
 SEO vs Paid Search Savings Calculator
 SEO Share of Voice Calculator
 SEO ROI Calculator
 SEO Traffic and Revenue Forecast Calculator
 SEO Budget Calculator
 SEO Break-Even Calculator
 SaaS SEO ROI Calculator
 ROAS Calculator
 Reading Time Calculator
 Ranking Gain Simulator
 Organic Traffic Value Calculator
 Organic Traffic Estimator and Website Traffic Checker
 LTV to CAC Ratio Calculator
 Local SEO ROI Calculator
 Link Building Cost Calculator
 Keyword Value Calculator
 Keyword Opportunity Score Calculator
 Keyword Density Calculator
 GEO ROI Calculator
 GEO Content Investment Calculator
 Ecommerce SEO ROI Calculator
 Customer Lifetime Value Calculator
 Customer Acquisition Cost Calculator
 CTR Calculator
 Cost Per Article Calculator
 Conversion Rate Calculator
 Content Marketing ROI Calculator
 ChatGPT Referral Traffic Estimator
 Bounce Rate Calculator
 Backlink ROI Calculator
 AI Visibility Score Calculator
 AI Traffic Value Calculator
 AI Share of Voice Calculator
 Cost of AI Invisibility Calculator
 AI Citation Rate Calculator
 llms.txt Validator
 AI Overview Checker and AI Overviews Rank Checker
 Robots.txt Checker
 AI SEO Audit
 LLM Readability Checker
 SearchGPT Readiness Checker
 Structured Data LLM Audit
 Website Crawlability AI Audit
 Why ChatGPT Is Not Recommending My Website
 Gemini Ranking Tool
 Perplexity Ranking Checker
 LLM Citation Checker
 Answer Engine Optimization Audit
 GEO Audit
 AI Search Visibility Test
 ChatGPT Visibility Checker
 llms.txt Generator
 URL Extractor
 Webpage to Markdown
 Sitemap Checker
 SERP Volatility Sensor
 Page Size Checker
 Word Counter
 Slug Generator
 Schema Generator
 Robots Generator
 OG Preview
 Meta Tags Generator
 Image Compressor
 Favicon Generator
 On-Page SEO Audit: SEO Checker and SEO Analyzer
 Backlink Analysis Tool
 Keyword Research Tool
 Domain Authority Checker
THEY TRIED SORANK BEFORE YOU
 “I tested Sorank on a real client site and it's insane. It does everything an agency would bill you $1500 a month for. It's going into production on that client now.”

 Guillaume Guersanguersanguillaume.com“We are an Ads agency and we wanted to get our SEO back on track once and for all. Sorank gave us a clear view of our site, helped us prioritize optimizations, and properly structure our content. The tool is easy to use, well designed for a team, and very practical for centralizing tracking without having to juggle multiple platforms. A very solid foundation to start fresh with our SEO.”
 Gaspard MadouiAds Agency
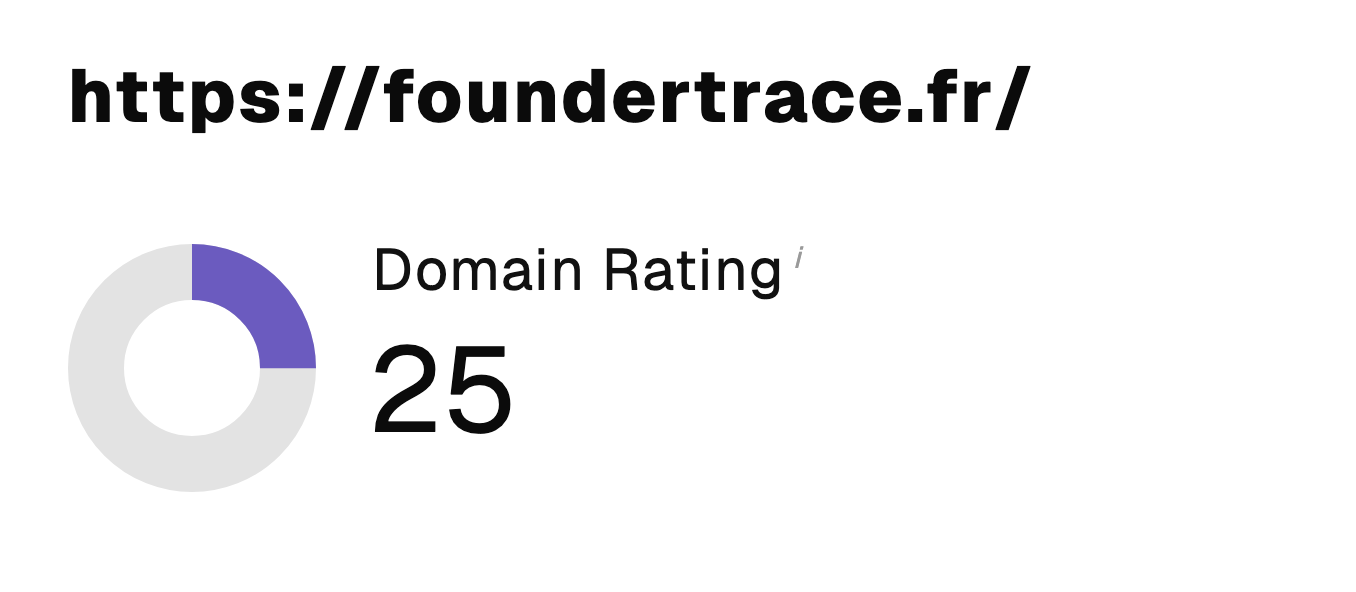 “I just let the Sorank software do its thing, and now my DR is 25 and my page is ranking higher.”
 Lucas Flandrefoundertrace.fr“I specialized in GEO thanks to Sorank. The GEO Leaderboard allows me to show my clients their position vs competitors on ChatGPT. It’s a real commercial differentiator.”
 MélanieSEO Freelance“Great service, works well for our website and helps us understand how to improve it to rank better on Google and elsewhere. Congrats, keep going, I recommend it.”
 Hugo T.E-commerce merchant