Preferences
Privacy is important to us, so you have the option of disabling certain types of storage that may not be necessary for the basic functioning of the website. Blocking categories may impact your experience on the website. More information

Privacy is important to us, so you have the option of disabling certain types of storage that may not be necessary for the basic functioning of the website. Blocking categories may impact your experience on the website. More information

Data-driven content marketing: which data should guide your topics, and how to publish original studies that earn links and AI citations. Method and examples.

Tools


In short
data-driven content marketing has two meanings. The first is steering content with data: choosing topics, formats and updates from Search Console, analytics, customer questions and the questions buyers ask AI assistants. The second is creating content from data: original studies, surveys, benchmarks and statistics that nobody else has. The first makes your content relevant; the second makes it worth citing, because journalists, bloggers and AI assistants need a primary source for every figure.
Want to go further? Ask
Most content repeats what already ranks. Data-driven content marketing breaks that loop at both ends: data tells you what to write, and your own data gives you something new to say. Google's guide to helpful, reliable, people-first content asks site owners whether their content provides "original information, reporting, research, or analysis". This guide covers the data that should guide your plan, why original data earns links and AI citations, the formats that work, a 7-step method to run a study, real examples and the mistakes to avoid.
The term covers two practices that reinforce each other.
Both belong in a content marketing strategy: the first decides where to invest, the second produces the assets that earn authority.
Six sources cover most decisions. The table shows what each one tells you and the decision it supports.
| Data source | What it tells you | Decision it supports |
|---|---|---|
| Google Search Console | Queries for which you already appear, impressions, clicks, positions | Update pages close to page one, create pages for queries without a dedicated answer |
| Analytics (GA4 or equivalent) | Pages that bring conversions, engagement, paths to purchase | Invest in the topics that bring customers, not only visits |
| Sales and support questions | Objections, recurring problems, vocabulary of customers | Write the answers your buyers need before they buy |
| Internal site search | What visitors look for and do not find | Fill gaps on the site itself |
| Competitor content | Topics and formats that rank in your market | Cover the missing topics with a better answer |
| Questions asked to AI assistants | Which brands ChatGPT, Gemini or Perplexity recommend on your buyers' questions | Publish the content that gets your brand cited on those questions |
Our method for competitive content analysis details the competitor part. For the AI part, the list of buyer questions works like a keyword list: Sorank's AI mention tracking shows, question by question, whether your brand is cited and who is cited instead.
A figure always needs a source. When a journalist, a blogger or an AI assistant writes "45% of B2B marketers lack a scalable content model", it links to the study that produced the figure, not to the hundred articles that repeated it. Original data gives your content information gain: something the other results do not contain.
Three mechanisms follow:
The format depends on the data you can access. Each one produces a different effect.
| Type of data | Format | Main effect |
|---|---|---|
| Survey of customers or of a profession | Annual survey report with key figures and charts | Media coverage and links, recurring every year |
| Proprietary product or usage data (anonymized and aggregated) | Index, benchmark or monthly report | Unique figures that only you can update, frequent citations |
| Public data (statistics offices, open data) | Analysis article, ranking, map | Local or sector coverage, good for long-tail searches |
| Experiment or test | Before and after case with method | Credibility with professionals, links from specialized blogs |
| Compilation of verified statistics | Statistics page, updated regularly | Steady links from writers looking for figures |
| Calculation model | Free calculator or tool | Repeated use, links from resource pages |
Our page of content marketing statistics is an example of a verified compilation, and the SEO share of voice calculator an example of a calculation model turned into a tool.
A good study answers a question your market asks and nobody has measured. "Which platforms do AI assistants cite most?" is precise; "the state of marketing" is not.
Survey, product data, public data or an experiment. Check that you have the right to use the data and that personal data is anonymized and aggregated.
Describe the population (who), the size (how many) and the period (when). A small sample is acceptable if you say so; a small sample presented as "all marketers" is not.
The disclosure standards of the American Association for Public Opinion Research (AAPOR) list what a serious survey discloses: sponsor, exact question wording, population, sampling method, sample size, fieldwork dates and limitations. Apply the same list to any study.
Report the figures that contradict your expectations too, separate correlation from causation and give the limits of the data.
Put the main answer and 5 to 10 key figures at the top, each in a full sentence with its unit and date, then the charts with a text version, the method and, if possible, the downloadable data. A figure in an image is invisible to most crawlers; a figure in a sentence can be quoted.
An annual or monthly edition turns a one-off study into a reference that people come back to and link again. The date in the title tells readers and AI assistants which edition is current.
The three share the same pattern: a precise question, a stated sample, a published method and a regular update.
Measure the two meanings separately. For content guided by data: organic traffic and conversions of the pages created or updated, compared with the period before. For content made from data: referring domains and mentions earned by the study, brand searches after publication, citations in AI answers on the questions it covers and your share of voice against competitors. Expect a study to keep earning links for months, especially if you update it.
Data-driven content marketing uses data twice: to decide what to publish, and as the raw material of content that others cite. Start with Search Console, analytics and customer questions to steer your plan, then publish one original study a year with a clear question, a stated sample and a public method. To cover the rest of your topics with sourced articles every month, Sorank's blog article generator writes and publishes content optimized for Google and AI assistants, with a 3-day free trial.

An annual survey report is the most common example: a company surveys its customers or a profession, publishes the key figures with the method and updates the study every year. Other examples are indexes built from aggregated product data, analyses of public statistics and pages that compile verified statistics with their sources.
There is no single minimum, because the right size depends on the population and on the precision you need. What matters for credibility is transparency: state who was surveyed, how many people answered, how they were recruited and when. A few hundred qualified respondents in a niche can be more useful than thousands of unqualified ones.
AI assistants cite sources to support the figures and facts in their answers, so the page that holds an original figure has a strong reason to be cited. Research on generative engine optimization found that adding statistics, quotations and sources improved the visibility of pages in generated answers. Track the questions that matter to you to check whether your studies are cited.
 AI Content Brief Generator
 FAQ Schema Generator
 AI Blog Post Ideas Generator
 Structured Data Validator
 Alt Text Checker
 Internal Link Analyzer
 Backlink Challenge
 AI Meta Description Generator
 AI Blog Title Generator
 Google Indexability Checker
 AI Blog Outline Generator
 UTM Link Builder
 Keyword Clustering Tool
 Canonical Tag Checker
 XML Sitemap Generator
 Broken Link Checker
 AI SEO Title Generator
 Headline Analyzer
 SERP Preview Tool
 Redirect Checker
 Hreflang Tag Generator
 Heading Structure Analyzer
 HTTP Headers Checker
 Favicon Extractor
 SERP CTR Calculator
 SEO vs Paid Search Savings Calculator
 SEO Share of Voice Calculator
 SEO ROI Calculator
 SEO Traffic and Revenue Forecast Calculator
 SEO Budget Calculator
 SEO Break-Even Calculator
 SaaS SEO ROI Calculator
 ROAS Calculator
 Reading Time Calculator
 Ranking Gain Simulator
 Organic Traffic Value Calculator
 Organic Traffic Estimator
 LTV to CAC Ratio Calculator
 Local SEO ROI Calculator
 Link Building Cost Calculator
 Keyword Value Calculator
 Keyword Opportunity Score Calculator
 Keyword Density Calculator
 GEO ROI Calculator
 GEO Content Investment Calculator
 Ecommerce SEO ROI Calculator
 Customer Lifetime Value Calculator
 Customer Acquisition Cost Calculator
 CTR Calculator
 Cost Per Article Calculator
 Conversion Rate Calculator
 Content Marketing ROI Calculator
 ChatGPT Referral Traffic Estimator
 Bounce Rate Calculator
 Backlink ROI Calculator
 AI Visibility Score Calculator
 AI Traffic Value Calculator
 AI Share of Voice Calculator
 Cost of AI Invisibility Calculator
 AI Citation Rate Calculator
 llms.txt Validator
 AI Overview Checker
 Robots.txt Checker
 AI SEO Audit
 LLM Readability Checker
 SearchGPT Readiness Checker
 Structured Data LLM Audit
 Website Crawlability AI Audit
 Why ChatGPT Is Not Recommending My Website
 Gemini Ranking Tool
 Perplexity Ranking Checker
 LLM Citation Checker
 Answer Engine Optimization Audit
 GEO Audit
 AI Search Visibility Test
 ChatGPT Visibility Checker
 llms.txt Generator
 URL Extractor
 Webpage to Markdown
 Sitemap Checker
 SERP Volatility Sensor
 Page Size Checker
 Word Counter
 Slug Generator
 Schema Generator
 Robots Generator
 OG Preview
 Meta Tags Generator
 Image Compressor
 Favicon Generator
 On-Page SEO Audit
 Backlink Analysis Tool
 Keyword Research Tool
 Domain Authority Checker
THEY TRIED SORANK BEFORE YOU
 “I tested Sorank on a real client site and it's insane. It does everything an agency would bill you $1500 a month for. It's going into production on that client now.”

 Guillaume Guersanguersanguillaume.com“We are an Ads agency and we wanted to get our SEO back on track once and for all. Sorank gave us a clear view of our site, helped us prioritize optimizations, and properly structure our content. The tool is easy to use, well designed for a team, and very practical for centralizing tracking without having to juggle multiple platforms. A very solid foundation to start fresh with our SEO.”
 Gaspard MadouiAds Agency
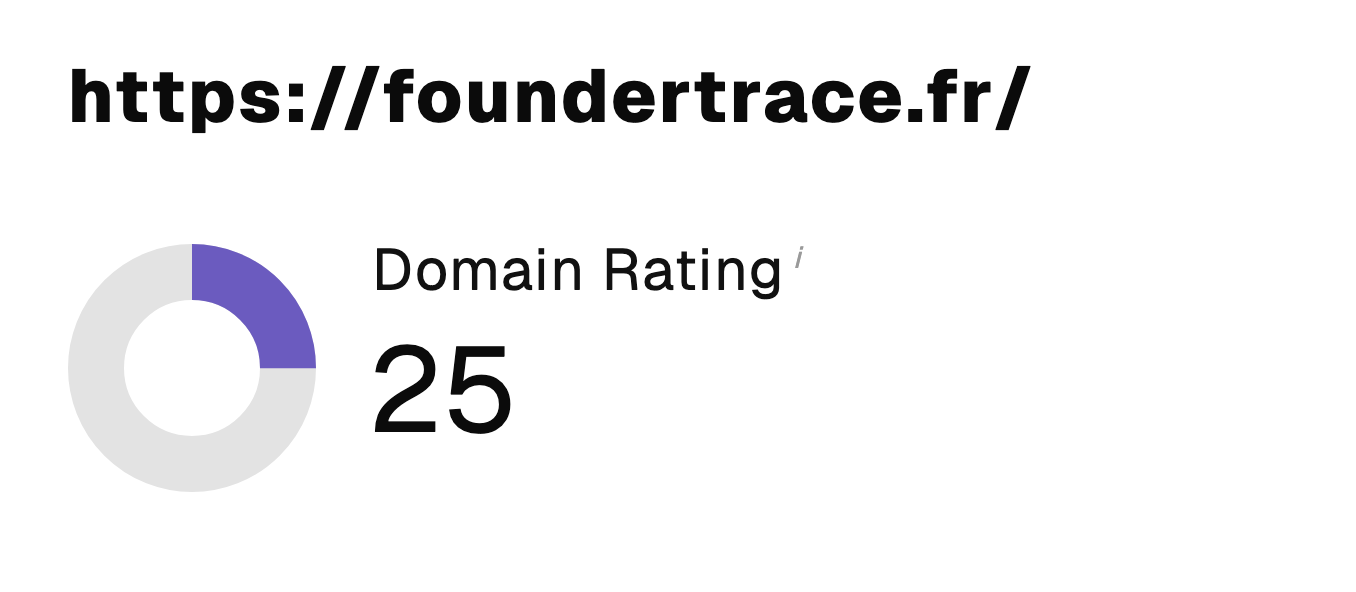 “I just let the Sorank software do its thing, and now my DR is 25 and my page is ranking higher.”
 Lucas Flandrefoundertrace.fr“I specialized in GEO thanks to Sorank. The GEO Leaderboard allows me to show my clients their position vs competitors on ChatGPT. It’s a real commercial differentiator.”
 MélanieSEO Freelance“Great service, works well for our website and helps us understand how to improve it to rank better on Google and elsewhere. Congrats, keep going, I recommend it.”
 Hugo T.E-commerce merchant