Preferences
Privacy is important to us, so you have the option of disabling certain types of storage that may not be necessary for the basic functioning of the website. Blocking categories may impact your experience on the website. More information

Privacy is important to us, so you have the option of disabling certain types of storage that may not be necessary for the basic functioning of the website. Blocking categories may impact your experience on the website. More information

SEO KPIs and SEO metrics explained: what to track for visibility, traffic, engagement, conversions and AI visibility, how to read them and which vanity metrics to drop.

Tools


In short
SEO KPIs are the few search metrics tied to a business goal, with a target and a deadline. Track them in five stages: visibility (impressions, rankings, share of voice), traffic (organic clicks and non-branded clicks), engagement (engagement rate, pages that lead somewhere), conversions (organic leads, sales, revenue) and AI visibility (citations of your brand in ChatGPT, Gemini, Perplexity or Claude). Choose three to six KPIs, read them together, and treat the other SEO metrics as diagnostics. Vanity metrics such as total keywords ranked or domain scores alone say little about results.
Want to go further? Ask
Most SEO dashboards contain forty numbers and answer no question. SEO KPIs exist to fix that: a short list of indicators that show whether search is moving the business, plus a wider set of SEO metrics that explain why. This guide lists the metrics that matter at each stage, how to read them in context and which ones to stop reporting.
An SEO metric is anything measurable; an SEO KPI is a metric you have committed to improve because it reflects a business objective. Impressions, average position and backlinks are metrics. Organic demo requests per month, with a target of 40 by the end of the quarter, is a KPI.
The distinction matters because metrics move for many reasons that have nothing to do with performance. Impressions can double because Google shows your page for irrelevant queries; average position can drop because you started ranking for thousands of new long-tail terms. A KPI forces the question "so what?" and keeps the team focused on outcomes.
Organize your SEO metrics by stage, from visibility to revenue, and choose one or two KPIs per stage that you can act on. The table gives the essentials.
| Stage | Metric | What it tells you | Main source |
|---|---|---|---|
| Visibility | Impressions on target queries | Whether Google shows your pages for the right searches | Google Search Console |
| Visibility | Rankings on a tracked keyword set | Progress on the queries you chose | Rank tracker |
| Traffic | Organic clicks, split branded and non-branded | Real visits, and how many come from people who did not know you | Google Search Console |
| Traffic | Click-through rate by page | Whether titles and snippets earn the click | Google Search Console |
| Engagement | Engagement rate of organic sessions | Whether visitors find what they came for | Google Analytics 4 |
| Conversion | Organic leads, sign-ups or sales | The first business outcome | Analytics, CRM |
| Revenue | Revenue or pipeline from organic | The return on the investment | CRM, e-commerce data |
| AI visibility | Brand citations on tracked prompts | Whether assistants recommend you | AI visibility tracker |
Use impressions and rankings on a defined set of target queries, not on every query you happen to appear for. The Search Console performance report counts an impression each time a link to your site appears in results, which makes it the most reliable visibility source, with up to 16 months of history.
Filter by the pages and queries that matter, and watch the trend over several weeks. A rise in impressions on target queries is usually the first sign that new content is being picked up, often weeks before clicks follow. Share of voice (your visibility relative to competitors on the same keyword set) adds the competitive view that absolute numbers miss.
Track organic clicks split between branded and non-branded queries, and the click-through rate of your main pages. Branded clicks reflect awareness you already have; non-branded clicks show SEO winning new audiences.
Keep in mind that AI Overviews and assistants answer some questions without a click. Stable impressions with falling clicks on informational queries often reflect that change rather than a loss of ranking.
Measure what organic visitors do after they land: engagement first, then the conversions that matter for your model. In Google Analytics 4, an engaged session lasts more than 10 seconds, includes a key event or views at least two pages; the engagement rate is the share of sessions that qualify.
Conversions depend on the business: a purchase for e-commerce, a demo or trial for SaaS, a call or quote request for a local business. Assign each conversion a value when you can, and look at assisted conversions too, since many visitors discover you through an article and convert later through another channel. For long B2B cycles, connect the CRM so that organic leads can be followed to signed deals; our guide to B2B SEO covers that measurement in detail.
Track a fixed list of prompts your buyers ask, run it on the main assistants every week and record whether your brand is cited, in what position and alongside which competitors. Search Console does not report these answers, so this KPI needs its own tracking.
Useful indicators are the citation rate (share of prompts where you appear), your AI share of voice against competitors, and the pages the assistants use as sources. Because answers vary from one run to the next, read the trend over several weeks rather than a single result.
A vanity metric looks good in a report but does not change a decision. These are the usual suspects:
| Vanity metric | Why it misleads | Better alternative |
|---|---|---|
| Total keywords ranked | Includes thousands of irrelevant positions beyond page one | Rankings on a tracked target set |
| Raw organic sessions | Mixes branded, irrelevant and converting traffic | Non-branded clicks and organic conversions |
| Domain authority score alone | A third-party estimate, not a Google metric | Referring domains from relevant sites |
| Average position across all queries | Falls when you gain new long-tail rankings | Position on priority pages and queries |
| Number of articles published | Measures effort, not results | Share of articles that earn clicks or citations |
These numbers can still help diagnose a problem. They become harmful when they replace business KPIs in the monthly report.
A good SEO report fits on one page: the KPIs with their target, the trend, a short explanation and the next actions. Keep diagnostics in an appendix for those who want them.
For the format and frequency of reports sent to managers or clients, see our guide to SEO reporting.
The right SEO KPIs connect search to business: a few indicators per stage, from impressions to revenue, plus AI citations now that assistants shape buying decisions. Keep the other SEO metrics for diagnosis, drop the vanity numbers from reports and judge progress over months, not days.
Sorank covers two of these stages for you: it publishes the articles that feed visibility and traffic on autopilot, and tracks every week whether ChatGPT, Gemini, Perplexity or Claude cite your brand on the prompts you choose, with a monthly PDF performance report on the Pro and Business plans. Compare the plans.

An SEO metric is any number you can measure, such as impressions, clicks or the number of backlinks. An SEO KPI is the small subset of metrics tied to a business objective with a target and a deadline, for example organic leads per month. Every KPI is a metric, but most metrics are only diagnostic and should not be reported as goals.
Three to six KPIs are enough for most teams: one or two for visibility, one for traffic quality and one or two for business outcomes, plus one for AI visibility if your market uses assistants. Track the other metrics in the background to diagnose changes, but report only the KPIs so that everyone focuses on the same decisions.
Review leading indicators such as impressions, rankings and AI citations weekly to spot problems early, and business KPIs such as organic conversions and revenue monthly, because SEO results move slowly and daily variations are mostly noise. Compare periods year over year when your traffic is seasonal, to avoid confusing seasonality with a real trend.
 AI Content Brief Generator
 FAQ Schema GeneratorAI Blog Post Ideas GeneratorStructured Data Validator
 Alt Text Checker
 Internal Link AnalyzerBacklink ChallengeAI Meta Description GeneratorAI Blog Title Generator
 Google Indexability CheckerAI Blog Outline GeneratorUTM Link BuilderKeyword Clustering ToolCanonical Tag Checker
 XML Sitemap GeneratorBroken Link CheckerAI SEO Title GeneratorHeadline AnalyzerSERP Preview ToolRedirect Checker
 Hreflang Tag GeneratorHeading Structure AnalyzerHTTP Headers CheckerFavicon Extractor
 SERP CTR Calculator
 SEO vs Paid Search Savings Calculator
 SEO Share of Voice Calculator
 SEO ROI Calculator
 SEO Traffic and Revenue Forecast Calculator
 SEO Budget Calculator
 SEO Break-Even Calculator
 SaaS SEO ROI Calculator
 ROAS Calculator
 Reading Time Calculator
 Ranking Gain Simulator
 Organic Traffic Value Calculator
 Organic Traffic Estimator
 LTV to CAC Ratio Calculator
 Local SEO ROI Calculator
 Link Building Cost Calculator
 Keyword Value Calculator
 Keyword Opportunity Score Calculator
 Keyword Density Calculator
 GEO ROI Calculator
 GEO Content Investment Calculator
 Ecommerce SEO ROI Calculator
 Customer Lifetime Value Calculator
 Customer Acquisition Cost Calculator
 CTR Calculator
 Cost Per Article Calculator
 Conversion Rate Calculator
 Content Marketing ROI Calculator
 ChatGPT Referral Traffic Estimator
 Bounce Rate Calculator
 Backlink ROI Calculator
 AI Visibility Score Calculator
 AI Traffic Value Calculator
 AI Share of Voice Calculator
 Cost of AI Invisibility Calculator
 AI Citation Rate Calculatorllms.txt ValidatorAI Overview CheckerRobots.txt CheckerAI SEO AuditLLM Readability CheckerSearchGPT Readiness Checker
 Structured Data LLM AuditWebsite Crawlability AI AuditWhy ChatGPT Is Not Recommending My Website
 Gemini Ranking ToolPerplexity Ranking CheckerLLM Citation CheckerAnswer Engine Optimization AuditGEO AuditAI Search Visibility TestChatGPT Visibility Checkerllms.txt Generator
 URL ExtractorWebpage to MarkdownSitemap CheckerSERP Volatility SensorPage Size Checker
 Word Counter
 Slug GeneratorSchema GeneratorRobots Generator
 OG PreviewMeta Tags Generator
 Image CompressorFavicon Generator
 On-Page SEO Audit
 Backlink Analysis Tool
 Keyword Research Tool
 Domain Authority Checker
THEY TRIED SORANK BEFORE YOU
 “I tested Sorank on a real client site and it's insane. It does everything an agency would bill you $1500 a month for. It's going into production on that client now.”

 Guillaume Guersanguersanguillaume.com“We are an Ads agency and we wanted to get our SEO back on track once and for all. Sorank gave us a clear view of our site, helped us prioritize optimizations, and properly structure our content. The tool is easy to use, well designed for a team, and very practical for centralizing tracking without having to juggle multiple platforms. A very solid foundation to start fresh with our SEO.”
 Gaspard MadouiAds Agency
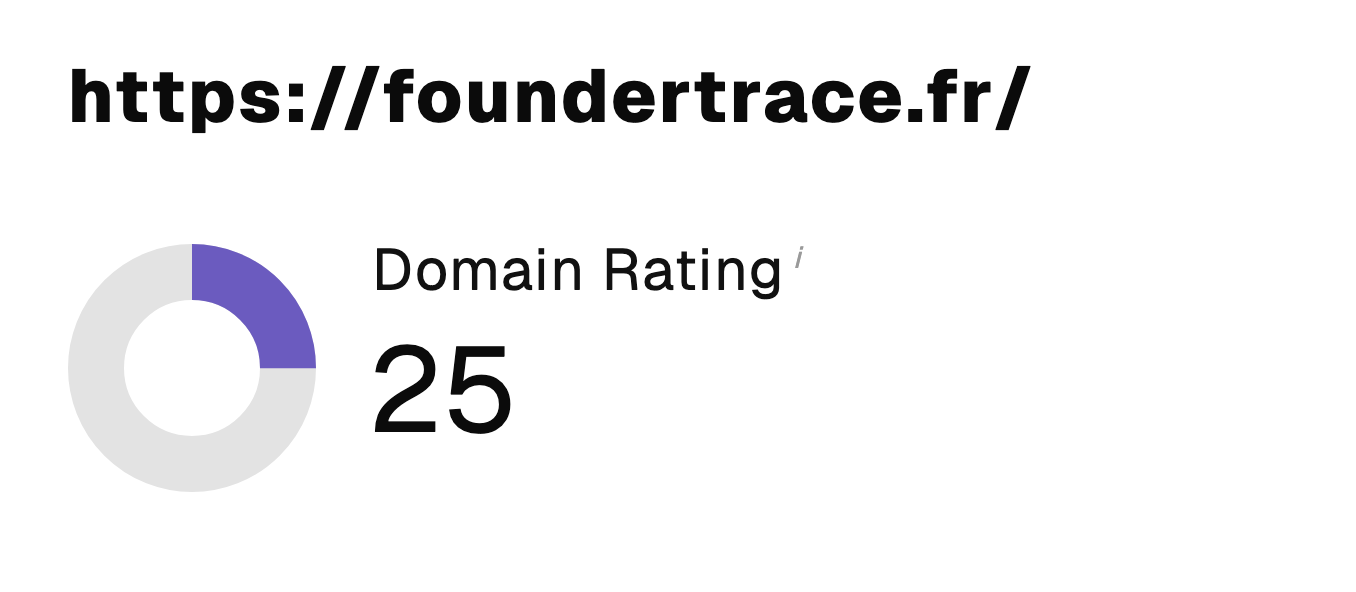 “I just let the Sorank software do its thing, and now my DR is 25 and my page is ranking higher.”
 Lucas Flandrefoundertrace.fr“I specialized in GEO thanks to Sorank. The GEO Leaderboard allows me to show my clients their position vs competitors on ChatGPT. It’s a real commercial differentiator.”
 MélanieSEO Freelance“Great service, works well for our website and helps us understand how to improve it to rank better on Google and elsewhere. Congrats, keep going, I recommend it.”
 Hugo T.E-commerce merchant