Preferences
Privacy is important to us, so you have the option of disabling certain types of storage that may not be necessary for the basic functioning of the website. Blocking categories may impact your experience on the website. More information

Privacy is important to us, so you have the option of disabling certain types of storage that may not be necessary for the basic functioning of the website. Blocking categories may impact your experience on the website. More information

PageSpeed Insights explained: field data vs lab data, Core Web Vitals thresholds, the performance score, and which fixes improve speed and SEO first.


Summarize this article with AI
PageSpeed Insights (PSI) is often the first tool marketers open when someone says the site is slow, and also the most misread. The score at the top is not what Google uses to rank pages, and a red number does not always mean a real problem for visitors. This guide explains how to read the report, based on Google's own documentation on Core Web Vitals and the PageSpeed Insights documentation.
Enter a URL at pagespeed.web.dev and you get two blocks for mobile and two for desktop:
The two often disagree. Field data reflects your real audience, their devices and networks. Lab data reflects one controlled test. When they differ, trust field data for the diagnosis of user experience, and use lab data to find causes.
Core Web Vitals are three metrics Google considers essential to user experience. Each is evaluated at the 75th percentile of page loads: 75% of visits must meet the threshold.
| Metric | What it measures | Good | Needs improvement | Poor |
|---|---|---|---|---|
| LCP (Largest Contentful Paint) | Time until the main content is displayed | 2.5 s or less | 2.5 s to 4 s | Over 4 s |
| INP (Interaction to Next Paint) | Responsiveness to clicks, taps and key presses | 200 ms or less | 200 ms to 500 ms | Over 500 ms |
| CLS (Cumulative Layout Shift) | Visual stability, unexpected movement of elements | 0.1 or less | 0.1 to 0.25 | Over 0.25 |
INP replaced First Input Delay (FID) as a Core Web Vital in March 2024. PSI also reports First Contentful Paint (FCP) and Time to First Byte (TTFB), which are useful for diagnosis but are not Core Web Vitals. You can read more in our page on Core Web Vitals and on Largest Contentful Paint.
The 0 to 100 score comes only from the Lighthouse lab test. It is a weighted average of five lab metrics: Total Blocking Time, Largest Contentful Paint, Cumulative Layout Shift, First Contentful Paint and Speed Index. A score of 90 or more is good, 50 to 89 needs improvement, under 50 is poor.
The score varies from one run to the next because network and server conditions change. Run the test several times and look at the trend, not at a single value. Above all, do not chase a 100: a page at 75 that passes the Core Web Vitals assessment in field data offers a better experience to real visitors than a page at 98 that fails it.
Core Web Vitals are part of the page experience signals used by Google's ranking systems. Google is clear that relevance and content quality come first: a fast page does not outrank a more useful one. Speed matters most as a tie breaker between comparable pages, and through its indirect effects: slow pages lose visitors before they load, convert less and are crawled less efficiently.
What PSI does not measure is just as important: content quality, search intent, backlinks or your presence in AI answers. A perfect score with thin content will not rank.
The "Opportunities" and "Diagnostics" sections list dozens of items. Prioritize by the metric that fails in field data.
Page weight also matters: very heavy HTML slows down both rendering and crawling. Check yours with our page size checker.
| Tool | Data | Best used for |
|---|---|---|
| PageSpeed Insights | Field (CrUX) and lab (Lighthouse) for one URL | Checking a specific page and finding causes |
| Lighthouse in Chrome DevTools | Lab only, on your own machine | Testing changes before release |
| Search Console, Core Web Vitals report | Field data grouped by similar URLs | Monitoring the whole site over time |
| PageSpeed Insights API | Same as PSI, automated | Testing many URLs on a schedule |
A practical routine: monitor the Search Console report monthly, open PSI on the URL groups flagged as poor, fix the cause, then use the "Validate fix" button in Search Console.
Use PageSpeed Insights to pass the Core Web Vitals in field data, not to reach a perfect score, then put your effort into content and authority. That is where rankings and AI citations are decided. Sorank automates that part: it writes and publishes optimized articles, builds backlinks and tracks how ChatGPT, Gemini and Claude mention your brand.

The performance score comes from a single Lighthouse lab test, and network, server load and third party scripts change between runs. Variations of several points are normal. Run the test three to five times and look at the median, and rely on field data for a stable view of real user experience.
Field data comes from the Chrome User Experience Report, which only publishes metrics for pages and sites with enough real Chrome traffic. A new or low traffic page has no data of its own. PSI then shows origin level data for the whole site if available, or only lab data.
No. Google uses Core Web Vitals measured on real users, not the Lighthouse score, and relevance and content quality weigh much more than speed. Aim to pass the Core Web Vitals assessment in field data, then invest in content, internal links and backlinks.
 AI Meta Description GeneratorAI Blog Title Generator
 Google Indexability CheckerAI Blog Outline Generator
 UTM Link Builder
 Keyword Clustering ToolCanonical Tag Checker
 XML Sitemap GeneratorBroken Link CheckerAI SEO Title GeneratorHeadline AnalyzerSERP Preview ToolRedirect Checker
 Hreflang Tag GeneratorHeading Structure AnalyzerHTTP Headers CheckerFavicon Extractor
 SERP CTR Calculator
 SEO vs Paid Search Savings Calculator
 SEO Share of Voice Calculator
 SEO ROI Calculator
 SEO Traffic and Revenue Forecast Calculator
 SEO Budget Calculator
 SEO Break-Even Calculator
 SaaS SEO ROI Calculator
 ROAS Calculator
 Reading Time Calculator
 Ranking Gain Simulator
 Organic Traffic Value Calculator
 Organic Traffic Estimator
 LTV to CAC Ratio Calculator
 Local SEO ROI Calculator
 Link Building Cost Calculator
 Keyword Value Calculator
 Keyword Opportunity Score Calculator
 Keyword Density Calculator
 GEO ROI Calculator
 GEO Content Investment Calculator
 Ecommerce SEO ROI Calculator
 Customer Lifetime Value Calculator
 Customer Acquisition Cost Calculator
 CTR Calculator
 Cost Per Article Calculator
 Conversion Rate Calculator
 Content Marketing ROI Calculator
 ChatGPT Referral Traffic Estimator
 Bounce Rate Calculator
 Backlink ROI Calculator
 AI Visibility Score Calculator
 AI Traffic Value Calculator
 AI Share of Voice Calculator
 Cost of AI Invisibility Calculator
 AI Citation Rate Calculatorllms.txt ValidatorAI Overview CheckerRobots.txt Checker
 AI SEO AuditLLM Readability CheckerSearchGPT Readiness Checker
 Structured Data LLM AuditWebsite Crawlability AI AuditWhy ChatGPT Is Not Recommending My Website
 Gemini Ranking ToolPerplexity Ranking CheckerLLM Citation CheckerAnswer Engine Optimization AuditGEO AuditAI Search Visibility TestChatGPT Visibility Checkerllms.txt Generator
 URL ExtractorWebpage to MarkdownSitemap CheckerSERP Volatility SensorPage Size Checker
 Word Counter
 Slug GeneratorSchema GeneratorRobots Generator
 OG PreviewMeta Tags Generator
 Image CompressorFavicon Generator
 On-Page SEO Audit
 Backlink Analysis Tool
 Keyword Research Tool
 Domain Authority Checker
THEY TRIED SORANK BEFORE YOU
 “I tested Sorank on a real client site and it's insane. It does everything an agency would bill you $1500 a month for. It's going into production on that client now.”
 Guillaume Guersanguersanguillaume.com“We are an Ads agency and we wanted to get our SEO back on track once and for all. Sorank gave us a clear view of our site, helped us prioritize optimizations, and properly structure our content. The tool is easy to use, well designed for a team, and very practical for centralizing tracking without having to juggle multiple platforms. A very solid foundation to start fresh with our SEO.”
 Gaspard MadouiAds Agency
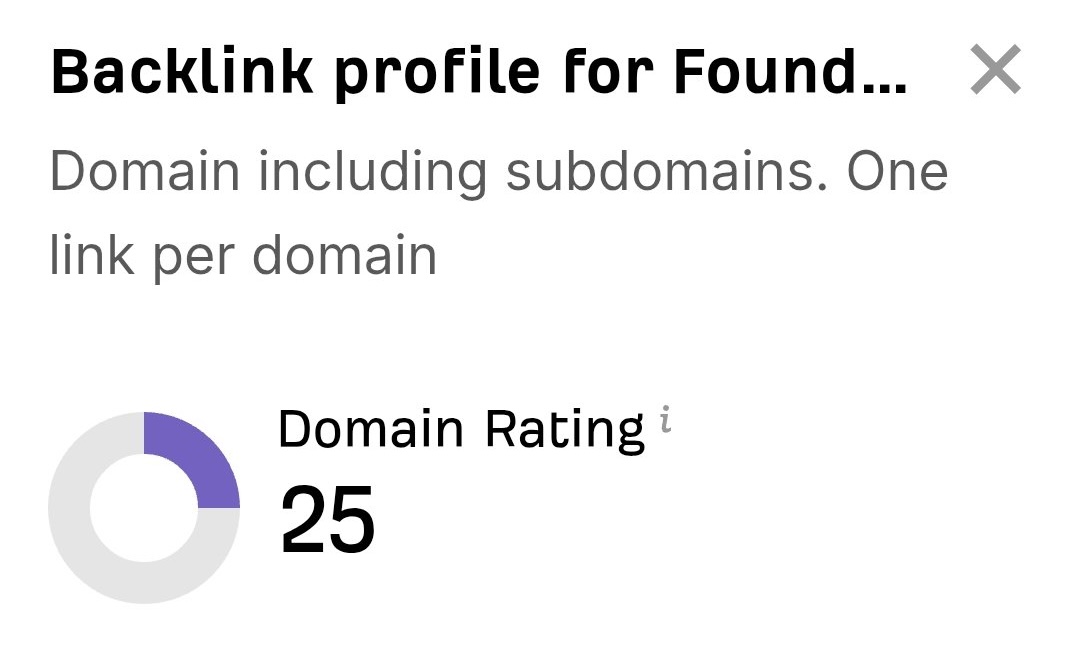 “I just let the Sorank software do its thing, and now my DR is 25 and my page is ranking higher.”
 Lucas FlandrePodcast Host“I specialized in GEO thanks to Sorank. The GEO Leaderboard allows me to show my clients their position vs competitors on ChatGPT. It’s a real commercial differentiator.”
 MélanieSEO Freelance“Great service, works well for our website and helps us understand how to improve it to rank better on Google and elsewhere. Congrats, keep going, I recommend it.”
 Hugo T.E-commerce merchant