Preferences
Privacy is important to us, so you have the option of disabling certain types of storage that may not be necessary for the basic functioning of the website. Blocking categories may impact your experience on the website. More information

Privacy is important to us, so you have the option of disabling certain types of storage that may not be necessary for the basic functioning of the website. Blocking categories may impact your experience on the website. More information

Content marketing metrics by goal: awareness, engagement, leads, revenue and AI visibility, where to measure them, how to pick 5 KPIs and the content ROI formula.

Tools


In short
content marketing metrics measure whether your content reaches people, holds their attention, brings leads and generates revenue. Choose them by goal: impressions and organic traffic for awareness, engagement rate for attention, conversions and cost per lead for acquisition, revenue and retention for business impact, plus citations and share of voice in AI answers. Track five KPIs tied to your goals, review them monthly and judge content over quarters, not weeks.
Want to go further? Ask
Almost every team says it measures its content; far fewer trust the numbers. In the Content Marketing Institute's B2B Content Marketing Benchmarks, Budgets, and Trends: Outlook for 2025 (980 B2B respondents, published October 2024), 96% say they measure content performance, but only 51% agree their organization measures it effectively, and attributing ROI to content is the top measurement challenge, cited by 56%. This guide lists the content marketing metrics that matter for each goal, where to find them, how to choose your KPIs, how to calculate ROI and which new metrics AI assistants add.
A metric is any number you can measure: page views, time on page, shares. A KPI (key performance indicator) is a metric tied to a business goal, with a target and a deadline: "40 demo requests per month from the blog by June". All KPIs are metrics; most metrics are not KPIs.
The distinction protects you from vanity metrics. An article with 10,000 views and no lead is a success for awareness and a failure for acquisition. Start from the goal, then pick the metric that proves progress toward it.
| Goal | Metric | Definition | Where to measure it | How to read it |
|---|---|---|---|---|
| Awareness | Impressions | How often a link to your site appeared in Google results | Search Console | Rising impressions show Google tests your pages on more queries |
| Awareness | Organic traffic | Visits from unpaid search results | Analytics, Search Console clicks | Compare with the same period last year to remove seasonality |
| Awareness | Branded searches | Searches containing your brand name | Search Console (query filter) | A slow rise signals that content builds recognition |
| Engagement | Engagement rate | Share of engaged sessions | Google Analytics 4 | Low on an article: the page may not match the intent |
| Engagement | Average engagement time | Time the page was in focus | Google Analytics 4 | Compare articles of similar length, not all pages |
| Engagement | Scroll depth | Share of readers reaching 50% or 90% of the page | Analytics events | Shows where readers stop |
| Acquisition | Conversions per page | Sign-ups, quote or demo requests started from the page | Analytics key events | The most useful number to rank your articles |
| Acquisition | Cost per lead from content | Content spending / leads from content | Spreadsheet, CRM | Compare with paid channels |
| Revenue | Content-influenced revenue | Revenue from customers who read content before buying | CRM with source tracking | Needs consistent tracking of first and assisted touches |
| Retention | Returning readers, subscribers | Readers who come back, newsletter growth | Analytics, email tool | Signals a relationship, not just a visit |
| AI visibility | AI citations and mentions | How often assistants cite your pages or name your brand | Manual checks or a tracking tool | Track the same prompt list every month |
Two definitions are worth knowing exactly. In Google Analytics 4, an engaged session lasts more than 10 seconds, has a key event or includes at least two page views; the bounce rate is simply the share of sessions that were not engaged. In Search Console, the Performance report defines CTR as clicks divided by impressions, and the average position as the average of the topmost position your link held. Our glossary entries on organic traffic and dwell time explain what these numbers can and cannot tell you.
The same KPI does not suit every format. A case study is not meant to bring traffic, and a glossary page is not meant to close deals. Judge each format on the job it does:
| Format | Main job | Primary metric | Secondary metric |
|---|---|---|---|
| Educational article | Be found on Google and in AI answers | Organic clicks on target queries | Clicks to a service or product page |
| Comparison or buying guide | Help a buyer choose | Conversions started from the page | Engagement rate |
| Case study | Remove doubts before a purchase | Views by prospects in the sales cycle | Deals where it was shared |
| Original study | Earn citations and links | Referring domains and AI citations | Branded searches |
| Newsletter | Keep the relationship | Click rate per issue | Subscriber growth and unsubscribes |
| Video | Explain and show | Average share of the video watched | Visits to the site from the video |
Reporting each format against its own job avoids the classic trap of cutting the case studies because they bring little traffic, when they are the pages that help sales close.
Five KPIs are enough for most teams: one per stage of the path from reader to customer, plus one for AI visibility.
Our guide to SEO KPIs details the search side, and the one on marketing analytics covers attribution across channels.
The formula is simple; the difficulty lies in the inputs.
Content ROI = (revenue attributed to content - content costs) / content costs x 100
Example: you spend $3,000 per month on content (writing, software, promotion, internal time) and the CRM attributes $9,000 of monthly revenue to customers who came through content. ROI = (9,000 - 3,000) / 3,000 x 100 = 200%.
The content marketing ROI calculator does the calculation from your own figures.
Buyers now ask ChatGPT, Gemini or Perplexity before they search on Google, and many answers never produce a click. Classic traffic metrics miss this exposure. Three GEO performance metrics fill the gap:
| Metric | What it measures | How to track it |
|---|---|---|
| Mention rate | Share of tested prompts where the assistant names your brand | A fixed list of 25 to 100 buyer prompts, checked monthly |
| Citation rate | Share of answers that link to one of your pages as a source | Same prompt list, sources recorded per answer |
| AI share of voice | Your mentions compared with competitors' mentions on the same prompts | Mentions by brand / total mentions |
AI share of voice is the most useful for comparisons; the AI share of voice calculator computes it from your counts. Our marketing AI citation study shows which types of sources assistants cite on marketing topics. Sorank automates this follow-up: AI mention tracking checks 25 to 150 prompts depending on the plan on ChatGPT, Claude and Gemini, and from the Pro plan on Perplexity and Grok, and shows who is cited instead of you.
A good dashboard answers one question at a glance: is content moving the business forward? Keep it to one page:
Our guide to building a Google Analytics dashboard explains the setup, and the one on SEO reporting covers how to present results to a manager or a client. Sorank's GEO and SEO dashboard gathers search performance and AI visibility in one view.
Content marketing metrics are useful only when each one is tied to a goal: reach, attention, leads, revenue and now AI visibility. Pick five, set a baseline, review them every month and give content the time it needs to compound.

The most important KPIs are those tied to your goal. For most businesses, a good set is organic clicks or impressions on target topics, engagement rate, conversions from content, cost per lead and brand mentions in AI answers. Traffic alone is not enough, because it says nothing about whether content brings customers.
New articles usually need a few months to rank and bring steady traffic, and leads follow once pages reach the first positions. Judge content over at least two quarters, and measure ROI over 6 to 12 months, because an article keeps working long after its publication date.
Build a fixed list of prompts your buyers ask, then check each month whether ChatGPT, Gemini, Perplexity and Claude mention your brand or cite your pages. Record the mention rate, the citation rate and the share of voice against competitors. A tracking tool automates these checks and keeps the history.
 AI Content Brief Generator
 FAQ Schema Generator
 AI Blog Post Ideas Generator
 Structured Data Validator
 Alt Text Checker
 Internal Link Analyzer
 Backlink Challenge
 AI Meta Description Generator
 AI Blog Title Generator
 Google Indexability Checker
 AI Blog Outline Generator
 UTM Link Builder
 Keyword Clustering Tool
 Canonical Tag Checker
 XML Sitemap Generator
 Broken Link Checker
 AI SEO Title Generator
 Headline Analyzer
 SERP Preview Tool
 Redirect Checker
 Hreflang Tag Generator
 Heading Structure Analyzer
 HTTP Headers Checker
 Favicon Extractor
 SERP CTR Calculator
 SEO vs Paid Search Savings Calculator
 SEO Share of Voice Calculator
 SEO ROI Calculator
 SEO Traffic and Revenue Forecast Calculator
 SEO Budget Calculator
 SEO Break-Even Calculator
 SaaS SEO ROI Calculator
 ROAS Calculator
 Reading Time Calculator
 Ranking Gain Simulator
 Organic Traffic Value Calculator
 Organic Traffic Estimator
 LTV to CAC Ratio Calculator
 Local SEO ROI Calculator
 Link Building Cost Calculator
 Keyword Value Calculator
 Keyword Opportunity Score Calculator
 Keyword Density Calculator
 GEO ROI Calculator
 GEO Content Investment Calculator
 Ecommerce SEO ROI Calculator
 Customer Lifetime Value Calculator
 Customer Acquisition Cost Calculator
 CTR Calculator
 Cost Per Article Calculator
 Conversion Rate Calculator
 Content Marketing ROI Calculator
 ChatGPT Referral Traffic Estimator
 Bounce Rate Calculator
 Backlink ROI Calculator
 AI Visibility Score Calculator
 AI Traffic Value Calculator
 AI Share of Voice Calculator
 Cost of AI Invisibility Calculator
 AI Citation Rate Calculator
 llms.txt Validator
 AI Overview Checker
 Robots.txt Checker
 AI SEO Audit
 LLM Readability Checker
 SearchGPT Readiness Checker
 Structured Data LLM Audit
 Website Crawlability AI Audit
 Why ChatGPT Is Not Recommending My Website
 Gemini Ranking Tool
 Perplexity Ranking Checker
 LLM Citation Checker
 Answer Engine Optimization Audit
 GEO Audit
 AI Search Visibility Test
 ChatGPT Visibility Checker
 llms.txt Generator
 URL Extractor
 Webpage to Markdown
 Sitemap Checker
 SERP Volatility Sensor
 Page Size Checker
 Word Counter
 Slug Generator
 Schema Generator
 Robots Generator
 OG Preview
 Meta Tags Generator
 Image Compressor
 Favicon Generator
 On-Page SEO Audit
 Backlink Analysis Tool
 Keyword Research Tool
 Domain Authority Checker
THEY TRIED SORANK BEFORE YOU
 “I tested Sorank on a real client site and it's insane. It does everything an agency would bill you $1500 a month for. It's going into production on that client now.”

 Guillaume Guersanguersanguillaume.com“We are an Ads agency and we wanted to get our SEO back on track once and for all. Sorank gave us a clear view of our site, helped us prioritize optimizations, and properly structure our content. The tool is easy to use, well designed for a team, and very practical for centralizing tracking without having to juggle multiple platforms. A very solid foundation to start fresh with our SEO.”
 Gaspard MadouiAds Agency
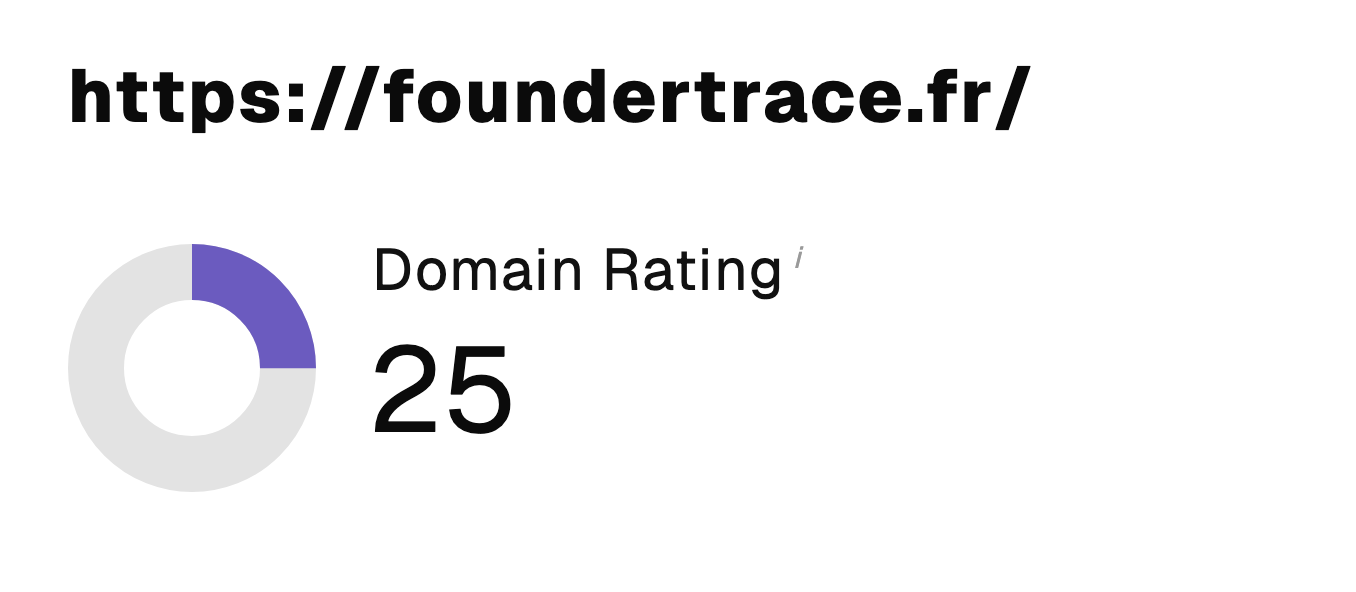 “I just let the Sorank software do its thing, and now my DR is 25 and my page is ranking higher.”
 Lucas Flandrefoundertrace.fr“I specialized in GEO thanks to Sorank. The GEO Leaderboard allows me to show my clients their position vs competitors on ChatGPT. It’s a real commercial differentiator.”
 MélanieSEO Freelance“Great service, works well for our website and helps us understand how to improve it to rank better on Google and elsewhere. Congrats, keep going, I recommend it.”
 Hugo T.E-commerce merchant