Preferences
Privacy is important to us, so you have the option of disabling certain types of storage that may not be necessary for the basic functioning of the website. Blocking categories may impact your experience on the website. More information

Privacy is important to us, so you have the option of disabling certain types of storage that may not be necessary for the basic functioning of the website. Blocking categories may impact your experience on the website. More information

Marketing analytics explained: the three types of analysis, the data stack, metrics by channel, attribution, privacy, and why AI traffic is often misattributed.

Tools


In short
marketing analytics is the practice of collecting, connecting and analyzing data from every marketing channel to understand what drives results and where to invest next. It works at three levels: descriptive (what happened), diagnostic (why it happened) and predictive (what will likely happen). A solid setup combines a collection layer (analytics, ad platforms, CRM), a storage layer and a visualization layer, uses clear metrics per channel, accepts the limits of attribution, respects privacy rules, and isolates traffic from AI assistants, which standard reports often misclassify.
Want to go further? Ask
Marketing analytics answers questions that each tool alone cannot: which channel brings customers who stay, what a lead costs once all touchpoints are counted, which content contributes to sales. Its purpose is to support budget and content decisions.
| Type | Question | Example | Typical tools |
|---|---|---|---|
| Descriptive | What happened? | Organic traffic grew 20% last quarter | Google Analytics, ad platform reports, dashboards |
| Diagnostic | Why did it happen? | Growth came from five new guides ranking on Google | Explorations, segments, Search Console, cohort analysis |
| Predictive | What will likely happen? | At this pace, organic leads will cover half the pipeline in a year | Forecasting, marketing mix models, machine learning |
Some teams add a fourth level, prescriptive analytics, which recommends actions (shift budget from channel A to channel B). It relies on the three others being reliable.
When data grows, teams centralize it in a spreadsheet, then in a data warehouse (BigQuery, Snowflake and similar), using connectors that sync each source daily. GA4 offers a free export to BigQuery, which removes sampling and quota limits for analysis.
Dashboards in Data Studio (formerly Looker Studio), Power BI, Tableau or a reporting tool turn the data into a few pages that each team reads. Our comparison of the best web analytics tools covers the collection side.
| Channel | Activity metrics | Result metrics |
|---|---|---|
| SEO | Impressions, average position, click-through rate | Organic sessions, leads, revenue from organic |
| AI visibility (GEO) | Brand mentions and citations in AI answers | Sessions from AI assistants, branded searches |
| Paid search and social | Impressions, clicks, cost per click | Cost per acquisition, return on ad spend |
| Delivery, open rate, click rate | Conversions and revenue per email | |
| Social media (organic) | Reach, engagement, shares | Profile visits, sessions, leads |
| Content | Pages published, reading time | Assisted conversions, newsletter sign-ups |
Above channels, two business metrics connect marketing to finance: the customer acquisition cost (CAC) and the customer lifetime value (LTV). A ratio of LTV to CAC well above 1 means acquisition pays for itself; our free LTV to CAC ratio calculator does the math. Then improve the share of visitors who convert with conversion rate optimization.
Attribution assigns the credit of a conversion to the touchpoints that preceded it. The main models are:
Attribution only sees tracked clicks. For the bigger picture, teams also use marketing mix modeling, for example with Meridian, Google's open-source model, which estimates the effect of each channel from aggregated data over time, and incrementality tests, which compare a group exposed to a campaign with a group that is not.
The answer is first-party data (CRM, newsletter, logged-in users), server-side tagging, consent mode where relevant, and accepting that reports show trends rather than exact totals.
When ChatGPT, Gemini, Perplexity or Copilot recommend a brand, three things can happen. The user clicks a cited link, and the visit appears as a referral from the assistant's domain, mixed with other referrals unless you create a dedicated channel. The user copies the brand name and searches it on Google, and the visit appears as organic or branded search. Or the user types the URL directly, and the visit lands in direct traffic. This invisible part is often called AI dark traffic.
To measure it better: group AI referrers in a custom channel, watch the trend of branded searches in Search Console, add a "How did you hear about us?" field to forms, and track your brand's mentions in AI answers directly with an AI visibility tool.
Marketing analytics is useful when it connects each channel to revenue, admits what tracking cannot see, and leads to a decision every month. To grow the organic and AI channels that analytics often undervalues, Sorank publishes optimized articles on autopilot and tracks how often ChatGPT, Claude and Gemini cite your brand, with a 3-day free trial.

Web analytics measures what happens on a website or app: visits, pages, events, conversions. Marketing analytics is broader: it connects web data with ad platforms, CRM, email, social and sales data to understand the effect of marketing as a whole. Web analytics is one of its data sources.
Start with the data-driven model if your account has enough conversions, and compare it with last click to see which channels open journeys. No model is perfectly true, so use attribution to compare channels over time and confirm important budget decisions with incrementality tests or marketing mix modeling.
Not at the start. Small teams can work with Google Analytics, Search Console, ad platform reports and a dashboard tool. A data warehouse becomes useful when you combine many sources, need history beyond the tools' retention, or want to join marketing data with CRM and revenue at the customer level.
 AI Content Brief Generator
 FAQ Schema GeneratorAI Blog Post Ideas GeneratorStructured Data Validator
 Alt Text Checker
 Internal Link AnalyzerBacklink ChallengeAI Meta Description GeneratorAI Blog Title Generator
 Google Indexability CheckerAI Blog Outline GeneratorUTM Link BuilderKeyword Clustering ToolCanonical Tag Checker
 XML Sitemap GeneratorBroken Link CheckerAI SEO Title GeneratorHeadline AnalyzerSERP Preview ToolRedirect Checker
 Hreflang Tag GeneratorHeading Structure AnalyzerHTTP Headers CheckerFavicon Extractor
 SERP CTR Calculator
 SEO vs Paid Search Savings Calculator
 SEO Share of Voice Calculator
 SEO ROI Calculator
 SEO Traffic and Revenue Forecast Calculator
 SEO Budget Calculator
 SEO Break-Even Calculator
 SaaS SEO ROI Calculator
 ROAS Calculator
 Reading Time Calculator
 Ranking Gain Simulator
 Organic Traffic Value Calculator
 Organic Traffic Estimator
 LTV to CAC Ratio Calculator
 Local SEO ROI Calculator
 Link Building Cost Calculator
 Keyword Value Calculator
 Keyword Opportunity Score Calculator
 Keyword Density Calculator
 GEO ROI Calculator
 GEO Content Investment Calculator
 Ecommerce SEO ROI Calculator
 Customer Lifetime Value Calculator
 Customer Acquisition Cost Calculator
 CTR Calculator
 Cost Per Article Calculator
 Conversion Rate Calculator
 Content Marketing ROI Calculator
 ChatGPT Referral Traffic Estimator
 Bounce Rate Calculator
 Backlink ROI Calculator
 AI Visibility Score Calculator
 AI Traffic Value Calculator
 AI Share of Voice Calculator
 Cost of AI Invisibility Calculator
 AI Citation Rate Calculatorllms.txt ValidatorAI Overview CheckerRobots.txt CheckerAI SEO AuditLLM Readability CheckerSearchGPT Readiness Checker
 Structured Data LLM AuditWebsite Crawlability AI AuditWhy ChatGPT Is Not Recommending My Website
 Gemini Ranking ToolPerplexity Ranking CheckerLLM Citation CheckerAnswer Engine Optimization AuditGEO AuditAI Search Visibility TestChatGPT Visibility Checkerllms.txt Generator
 URL ExtractorWebpage to MarkdownSitemap CheckerSERP Volatility SensorPage Size Checker
 Word Counter
 Slug GeneratorSchema GeneratorRobots Generator
 OG PreviewMeta Tags Generator
 Image CompressorFavicon Generator
 On-Page SEO Audit
 Backlink Analysis Tool
 Keyword Research Tool
 Domain Authority Checker
THEY TRIED SORANK BEFORE YOU
 “I tested Sorank on a real client site and it's insane. It does everything an agency would bill you $1500 a month for. It's going into production on that client now.”

 Guillaume Guersanguersanguillaume.com“We are an Ads agency and we wanted to get our SEO back on track once and for all. Sorank gave us a clear view of our site, helped us prioritize optimizations, and properly structure our content. The tool is easy to use, well designed for a team, and very practical for centralizing tracking without having to juggle multiple platforms. A very solid foundation to start fresh with our SEO.”
 Gaspard MadouiAds Agency
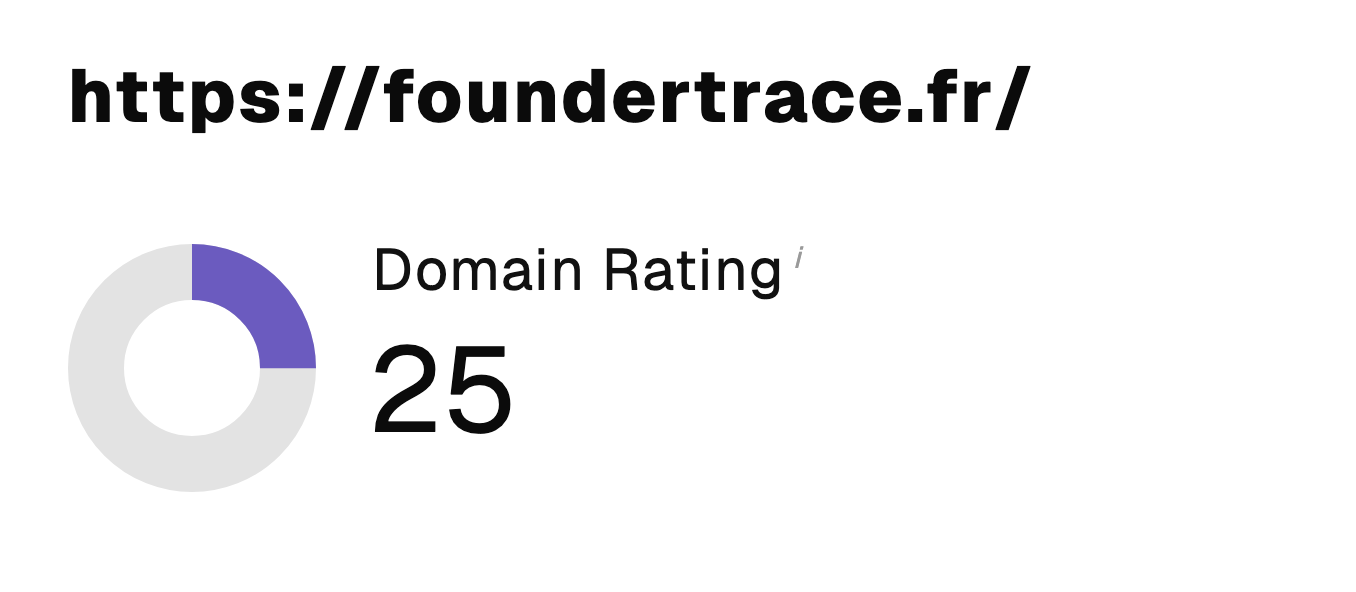 “I just let the Sorank software do its thing, and now my DR is 25 and my page is ranking higher.”
 Lucas Flandrefoundertrace.fr“I specialized in GEO thanks to Sorank. The GEO Leaderboard allows me to show my clients their position vs competitors on ChatGPT. It’s a real commercial differentiator.”
 MélanieSEO Freelance“Great service, works well for our website and helps us understand how to improve it to rank better on Google and elsewhere. Congrats, keep going, I recommend it.”
 Hugo T.E-commerce merchant