Preferences
Privacy is important to us, so you have the option of disabling certain types of storage that may not be necessary for the basic functioning of the website. Blocking categories may impact your experience on the website. More information
Privacy is important to us, so you have the option of disabling certain types of storage that may not be necessary for the basic functioning of the website. Blocking categories may impact your experience on the website. More information

Learn which social media analytics metrics matter, how to measure social traffic in  Google Analytics 4 with UTM tags, and a monthly method to act on them.


In short
Social media analytics measures what your posts do: who sees them, who reacts, who clicks through to your site, and who buys. Read the post numbers inside each network, then check the visits and conversions in Google Analytics 4, with a UTM tag on every link you publish. Compare each platform with its own past results, and tie every metric to one business goal.
Want to go further? Ask
Quick quiz
Which social network should you focus on?
Sorank matches your answers


Test it for 3 days on your own site and see where you stand on Google, ChatGPT and the other AIs.
Start 3-day free trial3 days free, then stop whenever you want. 90-day results guarantee, conditions apply.
Social media analytics answers three questions. Did people see the post? Did they react, and did some of them leave the network for your site? Did those visits turn into a lead, a sale or a signup? Each question has its own data source. Most reports mislead because they mix the three sources together.
| Layer | Question it answers | Where you read it |
|---|---|---|
| Post performance | Did this post reach people and get reactions? | The network's own insights |
| Traffic | Did people leave the network for my site? | Google Analytics 4, with UTM tags |
| Business result | Did the visit become a lead, a sale or a signup? | GA4 conversions, or your CRM |
If you are still choosing which networks to use, read our social media marketing guide first. This article starts where that one stops: you already publish, and you want to know whether it works.
A post with many likes is social data. It becomes analytics when you compare it with something: your last ten posts, the same format on another network, or the visits it sent to your site. Data tells you what happened. Analytics tells you what to do next.
Each network counts reach, impressions and engagement with its own rules. Buffer notes that every platform defines engagement differently, so compare a platform with its own history, not with another platform. Google Analytics has its own rules too. Expect gaps between tools, and write in your report which tool each number comes from.
A number is only useful when it changes a decision. Before you open any dashboard, list the decisions you make each month. Most teams make the same four.
| Decision | Metric to check first |
|---|---|
| Which platform gets next month's effort | Engagement rate on each platform, compared with that platform's average |
| Which format to repeat | Saves, shares, watch time and link clicks, grouped by format |
| Whether a post sends visitors | Link clicks, then Organic Social sessions in GA4 |
| Whether social brings revenue | Conversions from Organic Social in GA4, or leads tagged in your CRM |
Most social reports fail on the last column. They show reach and likes, but they never say which decision the numbers support.

A metric without a goal is decoration. Start with one business goal per channel. Then choose one main metric and one support metric for that goal. Keep the list short. Three to five metrics in a monthly report is enough for most teams.
| Goal | Main metric | Where to read it |
|---|---|---|
| Awareness | Reach, the number of distinct people who saw a post | Native insights of each network |
| Engagement | Engagement rate, from the formula in the next section | Native insights, calculated in a sheet |
| Traffic | Sessions from Organic Social, and the pages they land on | Google Analytics 4 |
| Leads or sales | Conversion rate from social | GA4 conversions, or your CRM |
If the goal is traffic or sales, the social media marketing plan is the place to fix the target before you measure it.
Follower count is the easiest number to read and the least useful on its own. An account can gain followers every month while its site receives the same number of visits. Followers are not revenue. Put follower growth next to sessions and conversions from social, so the gap between them is visible in the same report.
Take the last three months as the baseline for each metric. Without a baseline, a normal month looks like a success or a failure. Write the baseline next to the goal, with the date you took it, so the next report compares like with like.
Reach is the number of distinct people who saw a post. Impressions count every view, including repeat views by the same person, so impressions are always at least as high as reach. Audience data (location, age, language, follower growth) tells you whether the people you reach are the ones you want. Read it once a quarter. A weekly change in audience data is usually noise.
Engagement rate is the share of people who reacted to a post, compared with the people who saw it. Buffer defines it as total engagements divided by reach, times 100. The formula is simple, but the inputs are not. Some tools divide by followers instead of reach, and LinkedIn counts link clicks as engagements. Use one formula for every platform you compare, and write it at the top of your report.
Engagement rate = total engagements ÷ reach × 100
CTR             = link clicks ÷ impressions × 100
Conversion rate = conversions ÷ clicks × 100
Benchmarks help you judge a number, with one caveat. The medians below come from accounts that publish through one scheduling tool, and each platform counts engagement its own way. Read them as an orientation, then compare with your own average.
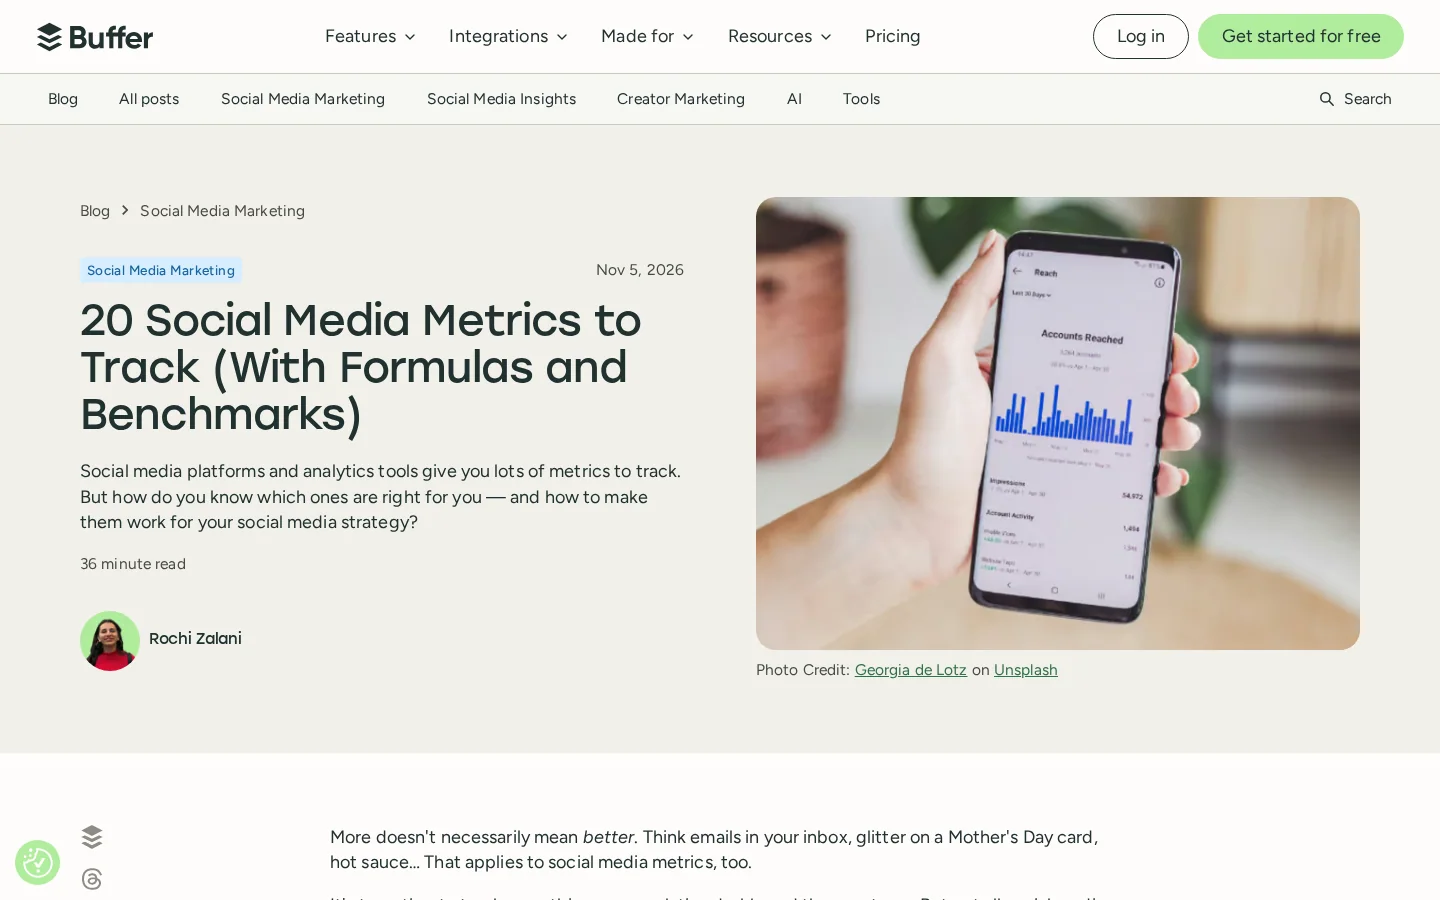
Two results stand out. LinkedIn has the highest median and X the lowest. Neither one tells you where to post. A brand with a small LinkedIn audience and a loyal X community should decide from its own history, and use the benchmark only to check whether its numbers are far off.
CTR shows whether a post makes people click. It depends on the offer, the format and the first line of the caption. Conversion rate shows what happens after the click. A high CTR with a low conversion rate usually means the post promised something the landing page does not deliver. Check both, because either one alone hides the problem.
Saves, shares, watch time and completion rate depend on the format. A carousel, a short video and a text post do not work on the same scale. Group posts by format, then compare each format with its own average. This is where the most useful decisions come from, because it tells you which format to repeat and which to drop.
To calculate engagement rate, divide the engagements on a post by its reach, then multiply by 100. A post with 1200 engagements and 15000 reach has an engagement rate of 8%. You can check one post with a pencil, and a spreadsheet does every row at once.
Before you trust the result, check that both numbers cover the same post and the same dates. Mismatched periods cause most wrong rates.
Use the columns of the sheet from the monthly routine. Reach sits in column E and engagements in column F. Put this formula in cell H2, then fill it down to the last post:
=IFERROR(ROUND(F2/E2*100, 1), "")
The IFERROR part leaves the cell empty when reach is zero, for example on a post that has not gone out yet, instead of showing an error.
There are two ways to average a format, and they give different answers. The simple average gives every post the same weight, so a post with 40 reach counts as much as one with 40000. The weighted rate adds all engagements, then divides by all reach. It is more stable when some posts reach very few people. Pick one method and write it at the top of your report.
=SUMIFS(F:F, C:C, "carousel") / SUMIFS(E:E, C:C, "carousel") * 100
Change "carousel" to any format name in column C. The result is the weighted engagement rate for that format.
To check a click-through rate instead, which divides clicks by impressions, use our free CTR calculator.
The network tells you how a post performed inside the network. Google Analytics 4 tells you what the visitor did on your site, including whether they bought. You need both. For the full setup of GA4 on a site, read Google Analytics for SEO.
GA4 groups visits into channels. A visit that arrives through a non-ad link on a social site is counted as Organic Social. A visit from an ad on a social site is counted as Paid Social. Google's documentation says GA4 assigns Organic Social when the source matches a list of social site patterns, or when the medium has a value such as social or sm.
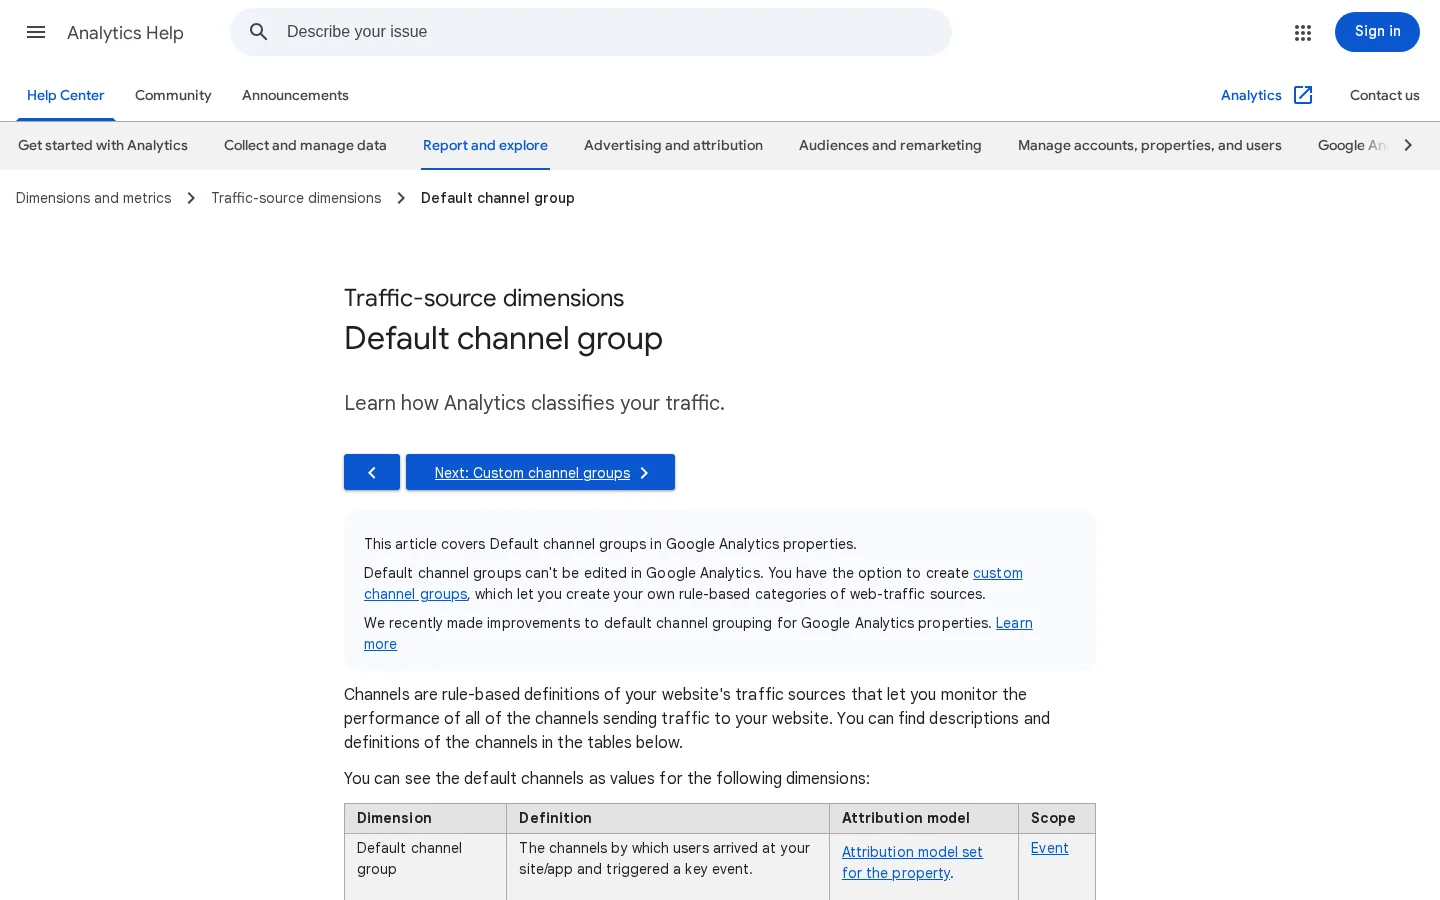
In GA4, open Reports, then Acquisition, then Traffic acquisition. Read the Session default channel group column. Compare Organic Social with Referral, because some networks send visits as referrals, and a post can show up in either channel.
UTM parameters are short labels added to the end of a link. They tell GA4 which network, which type of channel and which campaign sent the visit. Use three of them: utm_source for the network, utm_medium for the type of channel, and utm_campaign for the initiative. Here is a tagged link for a LinkedIn post:
https://www.example.com/guide?utm_source=linkedin&utm_medium=social&utm_campaign=spring-auditKeep the spelling identical across all posts. A typo or a different name creates a separate line in your report, and the campaign is split in two.
Tip
Build the tagged links with our free UTM link builder instead of typing the parameters by hand. Use one list of network names and campaign names, and copy it into every post brief.
Some visits lose their source. A link is copied into a private message, or opened from an app that hides where it came from. GA4 then files the visit under Direct. This is called dark social. It does not mean the post failed. It means the report undercounts that channel. Look for Direct spikes that follow a post date, and read them with that post in mind. Our glossary entry on AI dark traffic explains the same mechanism for visits from AI assistants.
Platform dashboards report link clicks, and those are the network's own count. Boston University's social media reporting guide says the clicks given by social platforms are notoriously inaccurate, and recommends Google Analytics for more precise measurement. Use the network for what happened to the post, and GA4 for what happened on your site.
Four methods cover most teams. They answer different questions and cost different amounts. Use each one for what it does well, and expect none of them to answer everything.
Principle. Each network shows how its own posts performed: reach, impressions, reactions, follower data and, for video, watch time.
Principle. Every link carries a label. GA4 counts the visits that came through it, and what those visits did on the site.
Principle. A paid tool connects several networks, schedules posts, and shows the numbers side by side, often with a view for the team.
For the way to build a single view of several sources, read our guide to the marketing dashboard.
Principle. The tool tracks what people say about a brand or a topic, including conversations where your account is not tagged.
| Method | What it measures | Question it answers best | Cost | Main limit |
|---|---|---|---|---|
| Native insights | Post performance on one network | Which post or format worked here? | Free | Stops at the network |
| UTM tags and GA4 | Visits and conversions from each link | Which channel brings customers? | Free | Depends on tagging, misses dark social |
| Management dashboard | Several networks in one view | How do all accounts compare? | Usually paid | Still uses each network's own numbers |
| Social listening | Mentions and conversations | What do people say about us? | Usually paid | Does not measure your own posts |
A social media dashboard should answer the four decisions from the start of this guide on one screen. Five panels cover them. Each panel uses one source, one date range and one owner. If a panel needs two sources, split it into two panels.
| Panel | Metric | Source | Decision it supports |
|---|---|---|---|
| Platform health | Engagement rate against that platform's own average | Native insights, one row per post | Which platform gets next month's effort |
| Format | Saves, shares and link clicks, grouped by format | Native insights | Which format to repeat |
| Traffic | Organic Social sessions and their landing pages | Google Analytics 4 | Whether posts send visitors |
| Revenue | Conversions from Organic Social | GA4 or your CRM | Whether social brings revenue |
| Audience check | Follower growth, shown next to sessions | Native insights | Whether the audience is healthy |
One tab per panel in a spreadsheet is enough for most teams, and it reuses the sheet from the monthly routine. Move to a reporting tool only when the copying takes longer than the review itself. Our guides to a Looker Studio dashboard and to marketing dashboards explain the setup and the limits of each option.
Most small teams need fewer tools than vendors suggest. For one to three networks, the free set does the job: the native insights of each network, a Google Analytics 4 property with tagged links, and one spreadsheet. A paid tool earns its place when the manual work takes more hours than the subscription costs, or when you need one view across several accounts.
| Job | Tool type | Typical cost | Check before you buy |
|---|---|---|---|
| Post results on one network | Native insights, such as LinkedIn analytics, TikTok Analytics or Meta Business Suite | Free | Export with one row per post |
| Visits and conversions | Google Analytics 4 with UTM tags | Free | Organic Social channel and conversions set up |
| Scheduling and reports across accounts | Social management platform | Usually paid, per seat or per account | Per-post export, UTM support, history length |
| What people say about your brand | Social listening tool | Usually paid | Which networks it covers |
Free tools have limits. Native insights stop at the network, and GA4 cannot see inside a post. Neither one gives you a single view of all accounts, so the spreadsheet from the monthly routine is the link between them. A paid tool will show different numbers from your baseline on the first day, because it counts some metrics its own way. Keep the sheet for three months, compare the two, and only then decide whether to drop it.
If you schedule posts, read our guide to social media automation first, to see which steps are safe to automate. For a side-by-side look at the management platforms, see our list of social media management tools.
The routine below takes one reporting period and turns it into one decision per platform. It works with free tools only. Add a dashboard later, once the routine is stable and you know which numbers you read every month.
The monthly routine in six steps
Keep one sheet with one row per post. The header below is enough to start. Add the GA4 numbers in a second tab, with the same campaign names, so that you can join them.
date,platform,format,url,reach,engagements,link_clicksCompute the engagement rate in a column next to these fields. Then use a filter on the format column to get the average for each format. Keep the raw rows, so that you can check any average later.
A single post that performs far above the rest lifts the average of its format. Read the median next to the average, and check whether one post carries the whole month. If it does, the lesson is about that post, not about the format. Write down what made it different before you copy it.
These six mistakes cause most of the wrong conclusions in social reports. For each one, you will see what it is, how to spot it in your own data, and how to correct it.
From raw numbers to a decision
What it is. Ranking networks by reach, and calling the top one the winner.
How to spot it. The network with the most followers always looks best, and it wins every month, whatever you publish there.
How to fix it. Compare the engagement rate of each platform with that platform's own average. Compare trends, not ranks.
What it is. Treating the follower count as the business result.
How to spot it. Followers rise, while the Organic Social sessions and the conversions in GA4 stay flat for several months.
How to fix it. Put sessions and conversions from social on the same page as follower growth. Keep follower growth as a check on audience health, not as the goal.
What it is. Publishing links that carry no campaign parameters.
How to spot it. Visits from social appear under Referral, Direct or Unassigned, and a campaign has no traffic record at all. Look for Direct spikes that follow a post date.
How to fix it. Tag every link before the post goes out, with the same names every time. Build the links with the UTM link builder, and keep the names in the sheet.
What it is. Reporting the network's click count and the GA4 sessions as if they were the same measure, then adding them.
How to spot it. The network reports more clicks than GA4 sessions for the same link and period, and the report sums the two.
How to fix it. Report platform clicks as clicks and GA4 sessions as visits. Explain the gap in one line, and do not add them together.
Warning
A total that mixes clicks and sessions looks precise, but it measures nothing in particular. Keep the two lines separate in every chart.
What it is. Changing the format, the posting time and the hashtags in the same month.
How to spot it. A result moves, and nobody can say which change caused it.
How to fix it. Change one variable per platform per month, and keep the rest the same. Write the change in the sheet, next to the date, so the next review can read it.
What it is. Reviewing posts and visits, but never counting the answers the account gives to comments and messages.
How to spot it. The monthly report has no line for replies, and nobody knows how long a comment waits before someone answers it.
How to fix it. Add two lines to the review: the number of replies, and the average time before a reply. Read them next to the engagement rate, so that the cost of the conversation is visible.
Sorank does not measure your posts on social networks. It works on the part of your traffic that comes from search. It connects Google Search Console and Google Analytics, shows clicks, impressions and position, and isolates the visits sent by AI assistants such as ChatGPT and Perplexity, page by page.
That makes it useful after social has done its job. When a page receives visits from Google and from AI assistants, or loses them, you see it in one place, without exports. Use the GEO / SEO dashboard for the site side, and keep the network's insights for the post side.
Two questions, two tools
If you also want to know whether assistants name your brand when people ask about your field, read about AI mention tracking. It records the prompts where your brand appears.
Use the native insights of each network for post performance, and Google Analytics 4 with UTM tags for visits and conversions. Both are free. Add a paid dashboard only when you manage several accounts and the monthly report takes too long to build by hand.
No single number is good for everyone. Buffer's 2025 medians are about 6.2% on LinkedIn, 5.6% on Facebook, 5.5% on Instagram, 4.6% on TikTok and 2.5% on X, for accounts that publish through its tool. Your own average over the last three months is a better target than any of them.
The two counts measure different things, so they will not match. Some visits arrive without a source, or from an app that removes the referrer, and GA4 files them under Direct. Check your untagged links first. Then accept the gap that remains, and explain it in one line in your report.
Before you trust a social number
To start this month, pick one goal, tag every link, and run the six steps once. The first report will be rough. The second one will tell you far more.
Use the native insights of each network for post performance, and Google Analytics 4 with UTM tags for visits and conversions. Both are free. Add a paid dashboard only when you manage several accounts and the monthly report takes too long to build by hand.
No single number is good for everyone. Buffer's 2025 medians are about 6.2% on LinkedIn, 5.6% on Facebook, 5.5% on Instagram, 4.6% on TikTok and 2.5% on X, for accounts that publish through its tool. Your own average over the last three months is a better target than any of them.
The two counts measure different things, so they will not match. Some visits arrive without a source, or from an app that removes the referrer, and GA4 files them under Direct. Check your untagged links first, then explain the remaining gap in one line in your report.
We analyse your competitors, your website and your AI visibility to create a tailored content plan for free.
 AI Content Brief Generator
 FAQ Schema Generator
 AI Blog Post Ideas Generator
 Structured Data Validator (Schema Validator)
 Alt Text Checker
 Internal Link Analyzer
 Backlink Challenge
 AI Meta Description Generator
 AI Blog Title Generator
 Google Indexability Checker
 AI Blog Outline Generator
 UTM Link Builder
 Keyword Clustering Tool
 Canonical Tag Checker
 XML Sitemap Generator
 Broken Link Checker
 AI SEO Title Generator
 Headline Analyzer
 SERP Preview Tool
 Redirect Checker
 Hreflang Tag Generator
 Heading Structure Analyzer
 HTTP Headers Checker
 Favicon Extractor
 SERP CTR Calculator
 SEO vs Paid Search Savings Calculator
 SEO Share of Voice Calculator
 SEO ROI Calculator
 SEO Traffic and Revenue Forecast Calculator
 SEO Budget Calculator
 SEO Break-Even Calculator
 SaaS SEO ROI Calculator
 ROAS Calculator
 Reading Time Calculator
 Ranking Gain Simulator
 Organic Traffic Value Calculator
 Organic Traffic Estimator and Website Traffic Checker
 LTV to CAC Ratio Calculator
 Local SEO ROI Calculator
 Link Building Cost Calculator
 Keyword Value Calculator
 Keyword Opportunity Score Calculator
 Keyword Density Calculator
 GEO ROI Calculator
 GEO Content Investment Calculator
 Ecommerce SEO ROI Calculator
 Customer Lifetime Value Calculator
 Customer Acquisition Cost Calculator
 CTR Calculator
 Cost Per Article Calculator
 Conversion Rate Calculator
 Content Marketing ROI Calculator
 ChatGPT Referral Traffic Estimator
 Bounce Rate Calculator
 Backlink ROI Calculator
 AI Visibility Score Calculator
 AI Traffic Value Calculator
 AI Share of Voice Calculator
 Cost of AI Invisibility Calculator
 AI Citation Rate Calculator
 llms.txt Validator
 AI Overview Checker and AI Overviews Rank Checker
 Robots.txt Checker
 AI SEO Audit
 LLM Readability Checker
 SearchGPT Readiness Checker
 Structured Data LLM Audit
 Website Crawlability AI Audit
 Why ChatGPT Is Not Recommending My Website
 Gemini Ranking Tool
 Perplexity Ranking Checker
 LLM Citation Checker
 Answer Engine Optimization Audit
 GEO Audit
 AI Search Visibility Test
 ChatGPT Visibility Checker
 llms.txt Generator
 URL Extractor
 Webpage to Markdown
 Sitemap Checker
 SERP Volatility Sensor
 Page Size Checker
 Word Counter
 Slug Generator
 Schema Generator
 Robots Generator
 OG Preview
 Meta Tags Generator
 Image Compressor
 Favicon Generator
 On-Page SEO Audit: SEO Checker and SEO Analyzer
 Backlink Analysis Tool
 Keyword Research Tool
 Domain Authority Checker
 “I tested Sorank on a real client site and it's insane. It does everything an agency would bill you $1500 a month for. It's going into production on that client now.”

 Guillaume Guersanguersanguillaume.com“We are an Ads agency and we wanted to get our SEO back on track once and for all. Sorank gave us a clear view of our site, helped us prioritize optimizations, and properly structure our content. The tool is easy to use, well designed for a team, and very practical for centralizing tracking without having to juggle multiple platforms. A very solid foundation to start fresh with our SEO.”
 Gaspard MadouiAds Agency
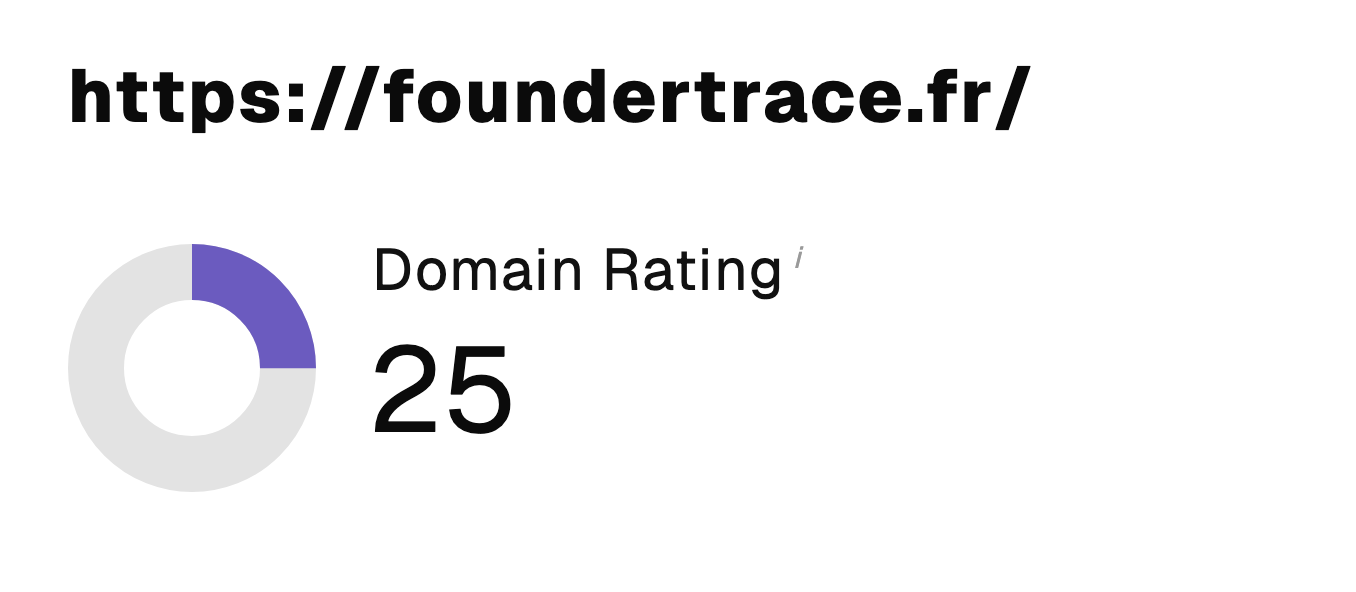 “I just let the Sorank software do its thing, and now my DR is 25 and my page is ranking higher.”
 Lucas Flandrefoundertrace.fr“I specialized in GEO thanks to Sorank. The GEO Leaderboard allows me to show my clients their position vs competitors on ChatGPT. It’s a real commercial differentiator.”
 MélanieSEO Freelance“Great service, works well for our website and helps us understand how to improve it to rank better on Google and elsewhere. Congrats, keep going, I recommend it.”
 Hugo T.E-commerce merchant