Preferences
Privacy is important to us, so you have the option of disabling certain types of storage that may not be necessary for the basic functioning of the website. Blocking categories may impact your experience on the website. More information
Privacy is important to us, so you have the option of disabling certain types of storage that may not be necessary for the basic functioning of the website. Blocking categories may impact your experience on the website. More information

Learn how to run a social media competitor analysis in 7 steps: pick rivals, track the metrics that matter, study their posts and turn findings into a plan.

In short
A social media competitor analysis compares your public activity with a small group of rivals over the same period. Pick three to five direct competitors, track the same metrics for each of them (audience growth, posting frequency, engagement rate), then study their best posts to find formats, topics and timing you can test. Repeat it every quarter and you get a plan, not a folder of screenshots.
Want to go further? Ask
Quick quiz
Which social network should you focus on?
Sorank matches your answers


Test it for 3 days on your own site and see where you stand on Google, ChatGPT and the other AIs.
Start 3-day free trial3 days free, then stop whenever you want. 90-day results guarantee, conditions apply.
A social media competitor analysis is a repeatable review of what rival brands do on social networks and how their audiences react. You look at the platforms they use, how often they post, which formats earn the most reactions, and what they promise their buyers. Then you change your own plan based on what you find. In short, you turn a feed into data you can compare.
It is not a scroll through their profiles on a Monday morning. A scroll shows you what happened to appear. An analysis shows you what happened over 90 days, with the same definitions for each brand, so the numbers can be compared. Brandwatch's guide, written by Sabrina Dorronsoro on March 20, 2026, frames the work as a loop: identify your competitors, analyze them, apply what you learn, then repeat the cycle regularly.
It also differs from an SEO competitor analysis. That review looks at keywords, pages and backlinks in search results. If you want that side, read our SEO competitor analysis guide. Here we focus on posts, audiences and the platforms themselves. If the terms are new to you, the competitor analysis glossary entry gives the short version.
The 7-step method
The rest of this guide follows these steps in order. Each section gives the practical details, the formulas and the mistakes that usually come with a step.
The biggest mistake is choosing the wrong rivals. Your list should be the brands that compete for the same buyer, not the biggest names in your category and not the brands you admire. A rival that is larger than you can still be useful, but only if it sells to the same people.
Brandwatch splits competitors into two groups. Direct competitors sell the same products to the same market. Indirect competitors sell something different to the same audience. You need both, but you should use them differently.
Direct or indirect rival?
Find candidates in three places. Start with a Google search for your main topics and note who appears in the top results. Next, look at which brands buy search ads for those terms. Last, search the same terms on TikTok, Instagram and YouTube, because some brands win attention there without ever ranking on Google.
Then cut the list to three to five direct competitors. Add one or two indirect rivals, usually a creator or a media brand that reaches your buyer with a different angle. With more than seven, each comparison becomes thin. A rival you cannot track every quarter is not a benchmark, it is a distraction.
An indirect rival is often a person, not a company. A creator who explains your category every week is competing for the same attention, even if they sell nothing. Their comments, their hooks and their format choices are useful to you. Do not track their revenue or their sponsors as if they were your sales numbers, because they are not.

Keep a platform only if it passes four tests. Your buyers use it. Your direct rivals are active on it. You can invest in it for at least a year. And you can get comparable data for every brand on the list. A platform that fails the last test can still matter, but you will have to track it by hand, so keep that list short.
A B2B software company often needs LinkedIn and YouTube more than TikTok. A consumer brand may find the reverse. Do not guess. Check where your buyers spend time, then check where your rivals post.
No single source shows everything. Your own analytics show your numbers in full, but not your rivals' private data. Public tools show what brands publish, but with gaps. The table below lists the usual options and their main limit.
| Source | What you get | Main limit |
|---|---|---|
| Your own analytics | Full data on your posts: reach, engagement, saves, shares | No access to rivals' private numbers |
| Meta Ad Library | Public ads from Meta products, with the creative and the platforms used | Shows active ads, and retention depends on the type and region of the ad |
| TikTok Creative Center | Public tools for trends and top ads on TikTok | Features and access change, so check the current page |
| Social listening tools | Mentions, share of voice and sentiment across networks | Paid, and based on the tool's own collection |
| Manual log | Full control over your tags and definitions | Takes hours every quarter, and errors creep in |
The Meta Ad Library is the public place to start if your rivals run ads on Facebook or Instagram. Meta's Ad Library tools page says that people can search for all active ads running across products from Meta. For ads about social issues, elections or politics, Meta also provides extra data, such as spend and reach, and keeps those ads visible whether they are active or inactive.
Use it to see which creative a rival is pushing right now. If a post from a rival got unusually high reach, search the brand in the Ad Library. If the same creative runs as an ad, the post was probably boosted, and you should not count it as organic reach. This is one of the most common mistakes, and it is covered later in this guide.
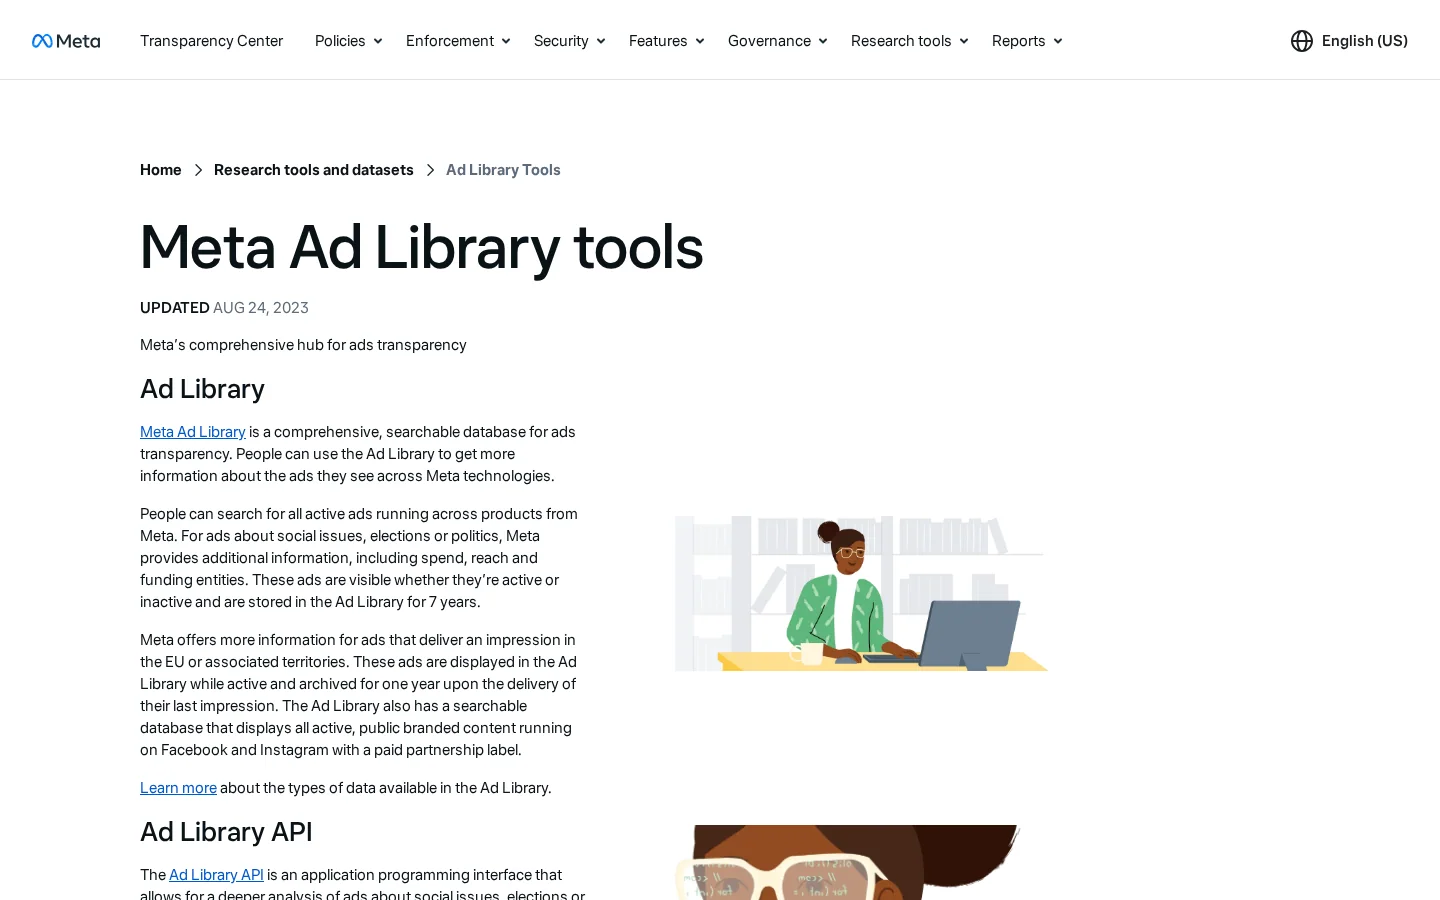
How long ads stay in the library
Source: Meta, Ad Library tools page
Retention rules decide how far back you can look, so check them before you plan a long comparison. Do not assume that a rival's old campaign will still be visible next year. Save the creative you need in your own sheet, with the date you saw it.
Pick a small set of metrics and define each one once. Use the same definition for every brand, on the same platform, over the same dates. Otherwise the comparison measures your spreadsheet, not the market.
Four metrics cover most of the work. Audience growth shows whether a brand is gaining people. Posting frequency shows how much effort goes into the feed. Engagement rate shows how the audience responds. Share of voice shows how much of the conversation a brand owns.
Audience growth (%)  = (followers_end - followers_start) / followers_start × 100
Posts per week       = posts_in_period / weeks_in_period
Engagement rate (%)  = (likes + comments + shares + saves) / reach × 100
Share of voice (%)   = your_mentions / all_brand_mentions_in_group × 100
Engagement rate has the most variants, so decide which denominator you use. Reach is usually more honest than follower count, because most people who see a post do not follow the account. If you use followers instead, write that in the sheet header so nobody mixes the two later.
In a spreadsheet, if likes, comments, shares and saves sit in columns C to F and reach sits in column G, the formula for row 2 is:
=ROUND((C2+D2+E2+F2)/G2*100,2)Drag it down and you have an engagement rate for every post. Then compare the average per brand, and look at the median too. One viral post can pull an average up so far that the brand looks stronger than it is.
Warning
Never compare engagement rates across platforms or across tools. A rate that looks high on one network can be normal on another. Compare each platform with itself, using the same tool, the same window and the same definition.
Ninety days is a good default. It is long enough to smooth out one launch and short enough to show a change in strategy. Use the same window for every brand, and check that the posts you count really fall inside it. Brands that post in bursts can look very different in a 30-day window than in a 90-day one.
Low-volume accounts need a different rule. A rival that posts twice a month gives you a thin sample over 90 days. In that case, use its last 20 posts instead, and write the rule in the sheet, so the next review uses the same method.
Numbers tell you which post worked. Content tells you why. The next step is to tag the top posts of each rival, so you can see patterns across brands rather than judging one post at a time.
A pillar is a recurring theme the brand returns to, such as product demos, customer stories, expert tips, behind-the-scenes or community posts. Most brands run three to five pillars. List them for each rival and count how many of its top posts fall into each one. A brand that gets most of its engagement from one pillar is telling you where its audience is.
For each top post, record five things: the URL, the format (short video, carousel, static image, live or text), the pillar, the hook (the first line or the first three seconds) and the call to action. Add the date and the shelf life, meaning how long the post kept getting reactions. The hook is where most of the difference lives. Two posts on the same topic can differ mainly because one opens with a question and the other opens with a result.
Look at the first line of each caption too. Many brands reuse the same opening pattern for weeks. Once you see it, you can test it on your own account, with one change at a time.
From a feed review to a tagged table
Posting rhythm and timing are two different questions. Check which days and hours each rival posts, and which days its best posts land on. If a rival posts on Tuesdays but gets its best results on Thursdays, that may be a clue, not a rule. Test it before you copy it.
Also read the replies. Go through the comments on the top ten posts of each rival. Questions show you what buyers still do not know. Complaints show you what the rival does not solve. Both are free research, and neither shows up in a dashboard.
A SWOT (strengths, weaknesses, opportunities, threats) is the usual way to close the analysis. Most SWOTs are useless because each point is an opinion. Make every point carry evidence: a number from your table, a post from the rival, or a comment from its audience. A point without evidence does not go in the plan.
The table below shows how to write each point so that it leads to a test, not a debate. The rows are examples, so replace them with your own findings.
| Quadrant | Example point, with evidence | Test to run |
|---|---|---|
| Strength | Our carousels get more saves than our videos on the same topics | Keep the carousel share as it is and track saves for 30 days |
| Weakness | A direct rival gets more comments per post on the same platform, and its comments ask questions our FAQ does not answer | Answer the top three questions in one post a week for four weeks |
| Opportunity | No direct rival posts in a format that buyers ask for in their comments | Publish one post in that format and compare reach with your usual posts |
| Threat | A rival's top posts come from a creator partnership every month | Run one creator collaboration with a clear brief and a review date |
Example
Say a rival posts short videos three times a week and gets more saves per post than you do. The SWOT entry is a weakness, with the saves figures attached. The test is simple: publish one short video a week for four weeks, on topics your audience already responds to, then compare saves per post with your text posts over the same period. If saves do not move, you have learned something for the cost of four videos.
Keep the action plan to two or three tests per quarter. Each test needs a goal, an owner, a success measure and a review date. More than that and nothing gets finished. The social media marketing plan guide shows how to fit these tests into a full calendar.
There is no single right structure. Three approaches cover most cases, and each one answers a different question. Choose the one that matches the decision you need to make, or combine a light version of two.
Principle: you pick one platform and benchmark every rival on it before you move on. When to use it: you are deciding where to invest next, or one network drives most of your results. Advantages: the comparison is clean, because every number comes from the same platform and the same rules. Limits: it misses campaigns that run across several networks at once. Example: you compare posting frequency, comment quality and follower growth on LinkedIn for five brands in a single sheet.
Principle: you take one rival at a time and study all of its channels. When to use it: one strong competitor keeps beating you, and you need to understand its whole strategy. Advantages: you see how the brand connects its platforms, its ads and its messages. Limits: benchmarking is harder, and the work takes longer. Example: a one-page profile of a rival on Instagram, YouTube and LinkedIn, with its pillars, its top posts and its ad creative.
Principle: you pick one format, such as short video, carousels or live sessions, and compare how all the brands use it. When to use it: you are deciding whether a format deserves budget or time. Advantages: you get quick, practical answers about hooks and structure. Limits: you lose the brand context, so a format that works for a big brand may fail for you. Example: the twenty top carousels from five brands, tagged by first slide, slide count and call to action.
| Method | Best question | Effort | Main risk |
|---|---|---|---|
| Channel-first | Where should we invest next? | Medium | Misses campaigns that run across platforms |
| Competitor-first | How does this rival win overall? | High | Too much time spent on one brand |
| Format-first | Is this format worth our time? | Low to medium | Ignores the brand context |
Most teams start with channel-first, because it gives clean numbers. They add format-first once they have a shortlist of formats to test. Competitor-first is for the rarer case where one rival is clearly setting the pace in your market.
Buyers now ask AI assistants which brands to choose, and those answers draw on what is published across the web, including on social platforms. A rival that is visible where AI tools look can appear in answers where you do not. Track that directly. Ask ChatGPT, Gemini, Claude or Perplexity the questions your buyers ask, and log which brands are named.
Sorank's GEO Leaderboard is built for this kind of check. It ranks the sites AI assistants cite for the prompts you track, under the heading "Who AI recommends instead of you".
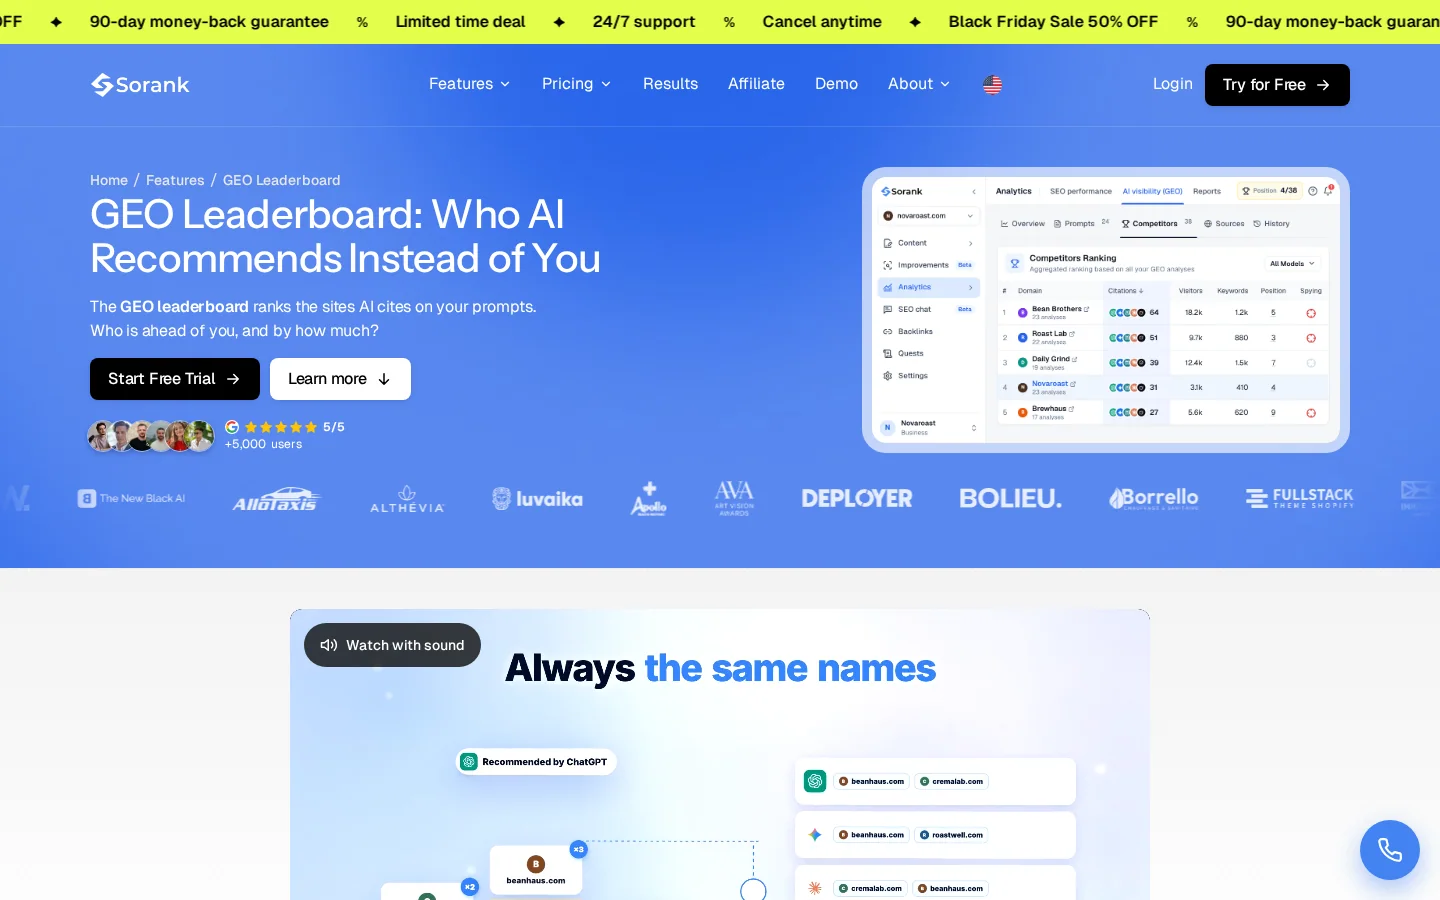
Keep those answers in the same sheet as your post tracking, so you can see whether a rival's social push comes before its AI mentions. That link is a hypothesis to test, not a proven rule, so treat it as one.
Which networks actually feed AI answers is an open question, and the answer changes. Our social media AI citation study looks at which networks AI tools cite, and social media search engines explains how TikTok, YouTube and Reddit rank results and which ones AI cites. Read both before you decide where to spend your rival tracking time.
These mistakes appear in almost every first analysis. Before you trust a comparison, run through the list below.
Before you trust a comparison
Each mistake below comes with what it is, how to spot it in your own work, and how to fix it.
What it is: putting a LinkedIn rate and an Instagram rate in the same ranking. How to spot it: your summary sheet has one column for all networks, sorted from highest to lowest. How to fix it: build one table per platform, and track your own trend over time on each one.
What it is: treating the biggest audience as the winning brand. How to spot it: a rival with a large following whose posts get very few reactions. Reach and engagement tell a different story than the follower count. How to fix it: put reach and engagement rate next to followers, and rank brands on those measures.
What it is: a rival's post gets huge reach, and you learn from it as if the brand had no budget behind it. How to spot it: the same creative appears in the Meta Ad Library as an active ad. How to fix it: tag every top post as organic or paid before you draw a conclusion, and keep paid creative in its own category.
Warning
A boosted post can make a weak creative look like a winning idea. If you copy it without checking the budget behind it, you copy the media spend, not the content.
What it is: using a traffic or audience estimate as if it were a measured number. How to spot it: the figure has no clear method and no range. How to fix it: label every estimate as an estimate, use it for direction only, and check your own numbers before you make a budget decision.
What it is: a single screenshot of a rival's profile, used as proof of how it works. How to spot it: your conclusion rests on one week or one post. How to fix it: use a 90-day window, with the same metrics for every brand.
What it is: you see a trend, you copy it, and you cannot say why it should work for you. How to spot it: your test has an idea but no hypothesis. How to fix it: write one sentence before each test: "We expect X because Y, and we will know in Z days." If you cannot finish that sentence, do not run the test yet.
What it is: a sheet with twenty brands on six platforms. How to spot it: the quarterly review takes two days and nobody reads the output. How to fix it: cut the list to three to five direct rivals and one or two indirect ones, and review the others only when they launch something big.
The first analysis is the hardest, because you build the sheet. After that, the routine takes a few hours per quarter. Here is a week that gets you to a usable first version.
For the quarterly routine, use the checklist below. It is short on purpose, so you can run it without rebuilding the sheet.
Quarterly checklist
If you also want to see which keywords your rivals rank for on Google, every week, Sorank's SEO Spy Tool tracks them for you. Your social sheet covers the other side of the picture.
Tip
To put a number on your search visibility next to your rivals, try the free SEO Share of Voice Calculator. It measures your search visibility against competitors, so you can set it beside your social numbers.
Start small. Five rivals, one platform, one 90-day window. A tight analysis that you repeat every quarter beats a huge one that you never finish.
It is a repeatable review of how rival brands use social networks: which platforms they use, what they post, and how their audience reacts. You use the findings to change your own plan. Unlike a quick look at rivals' feeds, it uses the same metrics and the same date range for every brand.
Start with three to five direct competitors, the brands that sell the same product to the same buyers. Add one or two indirect rivals, such as creators who reach your audience with a different angle. With more than seven rivals, each comparison becomes too thin to act on.
Run a full review once a quarter, over a window of about 90 days, with the same competitors and metrics each time. Run a short check in between when a rival launches a big campaign, a new brand gets attention, or a competitor changes its strategy.
We analyse your competitors, your website and your AI visibility to create a tailored content plan for free.
 AI Content Brief Generator
 FAQ Schema Generator
 AI Blog Post Ideas Generator
 Structured Data Validator (Schema Validator)
 Alt Text Checker
 Internal Link Analyzer
 Backlink Challenge
 AI Meta Description Generator
 AI Blog Title Generator
 Google Indexability Checker
 AI Blog Outline Generator
 UTM Link Builder
 Keyword Clustering Tool
 Canonical Tag Checker
 XML Sitemap Generator
 Broken Link Checker
 AI SEO Title Generator
 Headline Analyzer
 SERP Preview Tool
 Redirect Checker
 Hreflang Tag Generator
 Heading Structure Analyzer
 HTTP Headers Checker
 Favicon Extractor
 SERP CTR Calculator
 SEO vs Paid Search Savings Calculator
 SEO Share of Voice Calculator
 SEO ROI Calculator
 SEO Traffic and Revenue Forecast Calculator
 SEO Budget Calculator
 SEO Break-Even Calculator
 SaaS SEO ROI Calculator
 ROAS Calculator
 Reading Time Calculator
 Ranking Gain Simulator
 Organic Traffic Value Calculator
 Organic Traffic Estimator and Website Traffic Checker
 LTV to CAC Ratio Calculator
 Local SEO ROI Calculator
 Link Building Cost Calculator
 Keyword Value Calculator
 Keyword Opportunity Score Calculator
 Keyword Density Calculator
 GEO ROI Calculator
 GEO Content Investment Calculator
 Ecommerce SEO ROI Calculator
 Customer Lifetime Value Calculator
 Customer Acquisition Cost Calculator
 CTR Calculator
 Cost Per Article Calculator
 Conversion Rate Calculator
 Content Marketing ROI Calculator
 ChatGPT Referral Traffic Estimator
 Bounce Rate Calculator
 Backlink ROI Calculator
 AI Visibility Score Calculator
 AI Traffic Value Calculator
 AI Share of Voice Calculator
 Cost of AI Invisibility Calculator
 AI Citation Rate Calculator
 llms.txt Validator
 AI Overview Checker and AI Overviews Rank Checker
 Robots.txt Checker
 AI SEO Audit
 LLM Readability Checker
 SearchGPT Readiness Checker
 Structured Data LLM Audit
 Website Crawlability AI Audit
 Why ChatGPT Is Not Recommending My Website
 Gemini Ranking Tool
 Perplexity Ranking Checker
 LLM Citation Checker
 Answer Engine Optimization Audit
 GEO Audit
 AI Search Visibility Test
 ChatGPT Visibility Checker
 llms.txt Generator
 URL Extractor
 Webpage to Markdown
 Sitemap Checker
 SERP Volatility Sensor
 Page Size Checker
 Word Counter
 Slug Generator
 Schema Generator
 Robots Generator
 OG Preview
 Meta Tags Generator
 Image Compressor
 Favicon Generator
 On-Page SEO Audit: SEO Checker and SEO Analyzer
 Backlink Analysis Tool
 Keyword Research Tool
 Domain Authority Checker
 “I tested Sorank on a real client site and it's insane. It does everything an agency would bill you $1500 a month for. It's going into production on that client now.”

 Guillaume Guersanguersanguillaume.com“We are an Ads agency and we wanted to get our SEO back on track once and for all. Sorank gave us a clear view of our site, helped us prioritize optimizations, and properly structure our content. The tool is easy to use, well designed for a team, and very practical for centralizing tracking without having to juggle multiple platforms. A very solid foundation to start fresh with our SEO.”
 Gaspard MadouiAds Agency
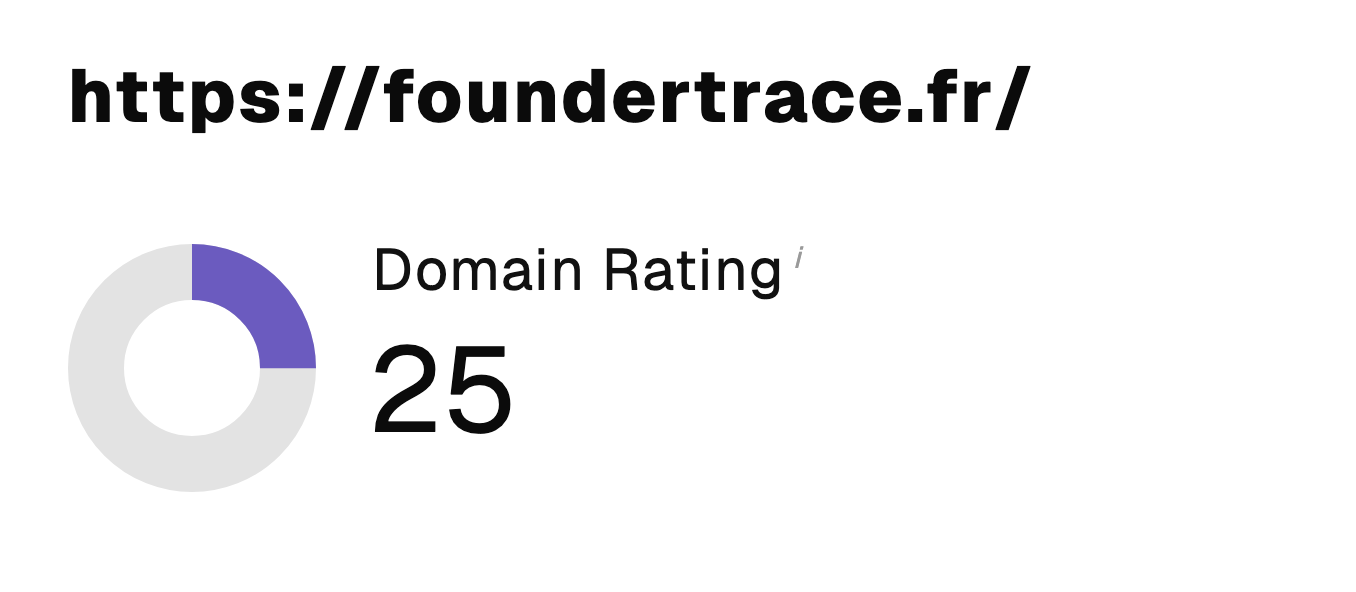 “I just let the Sorank software do its thing, and now my DR is 25 and my page is ranking higher.”
 Lucas Flandrefoundertrace.fr“I specialized in GEO thanks to Sorank. The GEO Leaderboard allows me to show my clients their position vs competitors on ChatGPT. It’s a real commercial differentiator.”
 MélanieSEO Freelance“Great service, works well for our website and helps us understand how to improve it to rank better on Google and elsewhere. Congrats, keep going, I recommend it.”
 Hugo T.E-commerce merchant