Preferences
Privacy is important to us, so you have the option of disabling certain types of storage that may not be necessary for the basic functioning of the website. Blocking categories may impact your experience on the website. More information
Privacy is important to us, so you have the option of disabling certain types of storage that may not be necessary for the basic functioning of the website. Blocking categories may impact your experience on the website. More information

Similarweb review for SEO: what its traffic estimates measure, where they mislead, what the plans cost and when to skip it, plus a quick test.

In short
Similarweb estimates the traffic, traffic sources, keywords and backlinks of any website, and it is strong for comparing competitors. Its numbers are modelled rather than measured, so read them as trends, never as exact counts. Reviews describe its higher plans as custom priced, so test it on a question you already know the answer to before you commit.
Want to go further? Ask
Quick quiz
Which way of finding customers online fits you best?
Sorank matches your answers


Test it for 3 days on your own site and see where you stand on Google, ChatGPT and the other AIs.
Start 3-day free trial3 days free, then stop whenever you want. 90-day results guarantee, conditions apply.
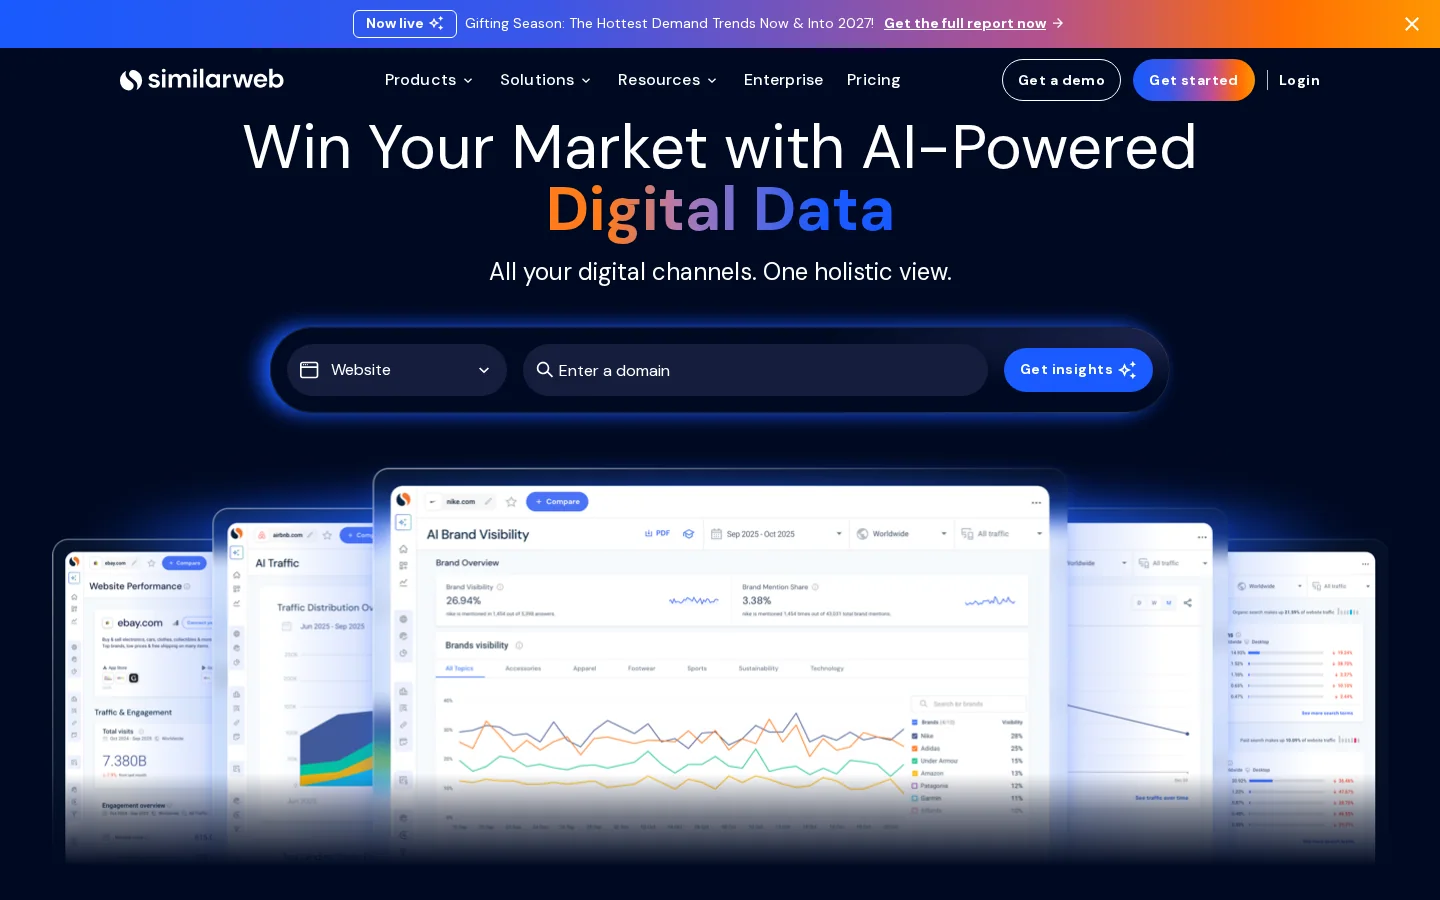
Similarweb is a web intelligence platform. You enter a domain and it shows an estimated monthly traffic figure, the mix of channels that bring visits (search, social, direct, referrals and AI chatbots), the keywords the site seems to rank for, and the sites that share its audience. It was built for market research, so its first users were analysts, investors and marketing teams that need to size a market before they spend money in it.
For SEO, the value comes down to one thing: you can look at a competitor without access to its analytics. You cannot open another site's Google Analytics. You can open Similarweb and see an estimate of its traffic and keyword footprint, and that changes what you decide to write about and which links you chase.
Enterprise teams, agencies that manage many client sites, consultants who write market reports and investors doing due diligence. A solo blogger with a small site gets less from it, because the estimates are weakest where traffic is lowest.
It does not write your articles, fix your pages or tell you why a page lost rankings. It shows you the market around your site. You still need your own data and your own execution to act on what it shows.
Most of what Similarweb shows you is modelled. Its own "How We Measure the Digital World" page lists four kinds of input: first-party analytics from websites that share their data, anonymous traffic data from Similarweb products installed on devices, publicly available data that is captured and indexed, and data pre-analysed by partners such as internet providers and measurement companies. The company then says its algorithms turn this noisy mass into one clear signal across all sources.
That is a sensible way to see a market. It is not a counter. A model built on panels and partners can get the direction and the rough size right, and still miss the exact number. The less traffic a site has, the less signal the model has to work with.
A panel is a sample. It records the browsing of the people and devices that are part of it, and the model extrapolates from that sample to the whole market. Sites whose audience sits inside the sample are easier to estimate. Sites whose audience is mostly outside it, such as a local service used by people who never install the relevant products, are harder, and the error can be large.
You cannot see the sample from the outside, so you cannot know which of your competitors are well covered. That is why the test in the accuracy section matters more than any single figure.
Estimate or measured: know which one you are reading

The product has grown from a traffic checker into a bundle. The main areas in its navigation are website traffic, AI traffic, keyword research, rank tracking, site audit, competitor analysis and backlink analytics, plus AI brand visibility and AI citation analysis. The table below says what each one answers and where it falls short for an SEO job.
| Feature | What it answers | Where it helps you | Where it falls short |
|---|---|---|---|
| Website traffic | How many visits a domain gets, and from which channels | Sizing a niche and spotting a competitor's growth | Modelled figures, weak for small sites |
| AI traffic | Estimated referrals from AI chatbots | Checking whether AI sends visits to a competitor | Often a small base, so the numbers are noisy |
| Keyword research | Keywords a domain seems to rank for | Finding topics a competitor already wins | Estimated positions, not your own data |
| Rank tracking | Position movement for keywords you pick | Watching a set of targets over time | Depends on how much history your plan keeps |
| Site audit | Technical issues on a site | A quick first look at a site | Not a full crawl of your own site |
| Competitor analysis | Which sites share an audience or a keyword space | Building a first competitor list | Lists depend on the model, so check them by hand |
| Backlink analytics | Which sites link to a domain | Finding link prospects | Check the counts against a second source before you budget outreach |
| AI brand visibility | How AI answers mention a brand | A first view of AI mentions | Depends on the prompts and models covered |
The keyword list is the part of the product most SEO teams open first. Use it as a list of candidates, not as a verdict. Sort the keywords a competitor seems to rank for by intent, then drop the ones that are plainly branded or off-topic. What remains is a shortlist you can check in Google, one query at a time, to confirm that the competitor really ranks and that the results match the intent you saw in the list.
Rank tracking works the same way. Pick the keywords you care about, keep the set small enough to review each week, and group them by topic so that a movement means something. A drop across a whole topic cluster is a signal to investigate. A move on one keyword is often noise. Remember that a tracked position for a keyword in Similarweb is an estimate, so compare it with what you see in Search Console before you change a page.
Similarweb also ranks every domain by its Global Rank. Its developer reference for Global Rank says the rank is "calculated based on a mix of our estimations of a site's monthly unique visitors", with monthly pageviews across desktop and mobile traffic. The reference lists monthly granularity with no daily split.
Treat the rank as a size indicator. It says how much traffic the model thinks a site gets compared with others. It does not say how good the site is, how well it converts or how much authority it has.
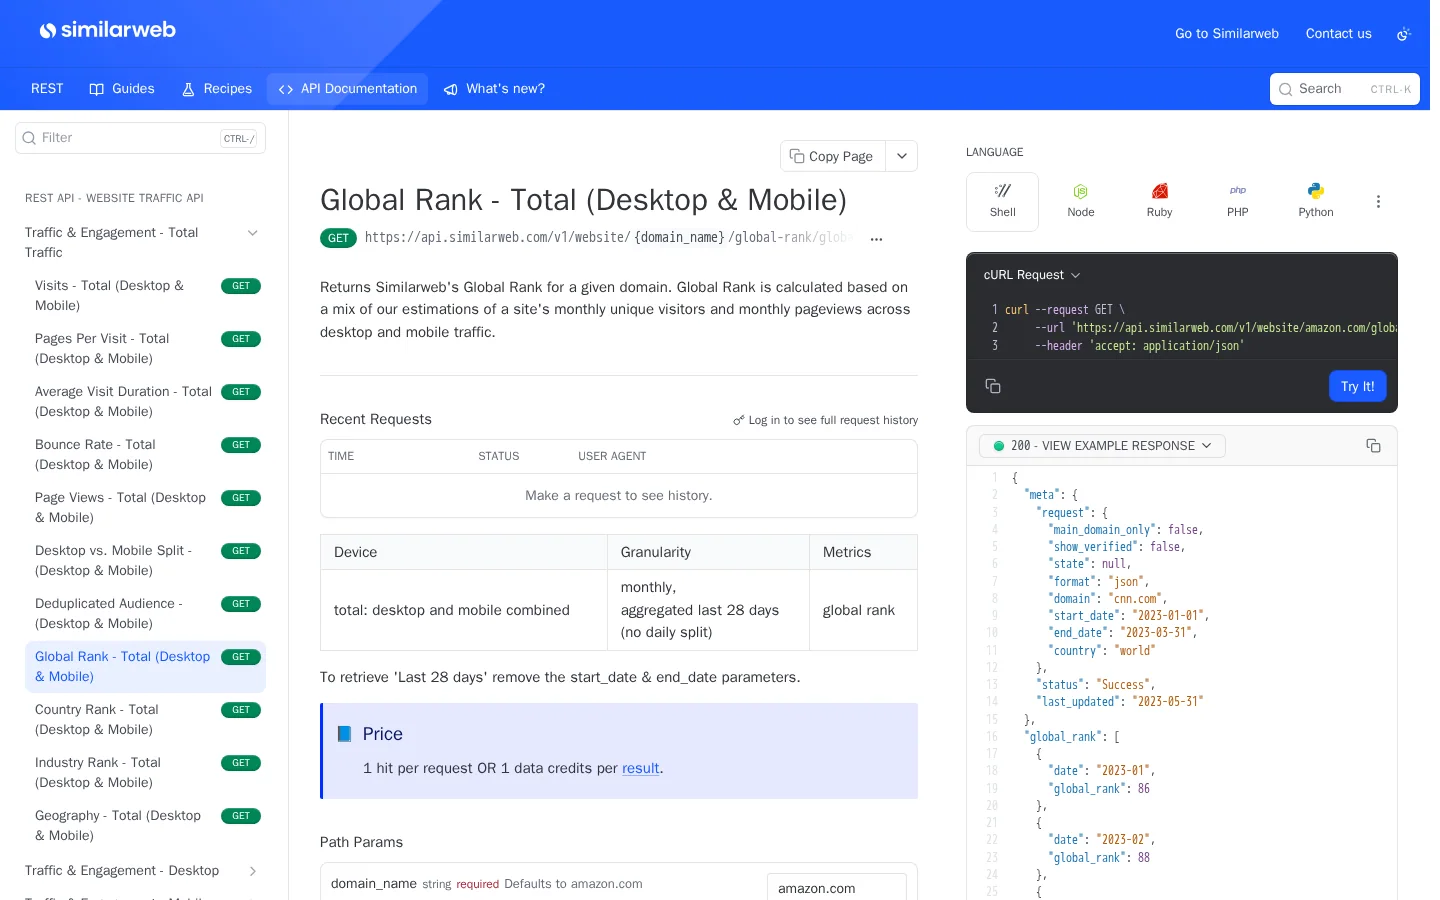
Accuracy depends on the site, the country and the month. The pages I read from Similarweb describe the method but do not publish an error margin, so assume that any single figure can be far off. Small and new sites are the hardest case, because there is little signal to model.
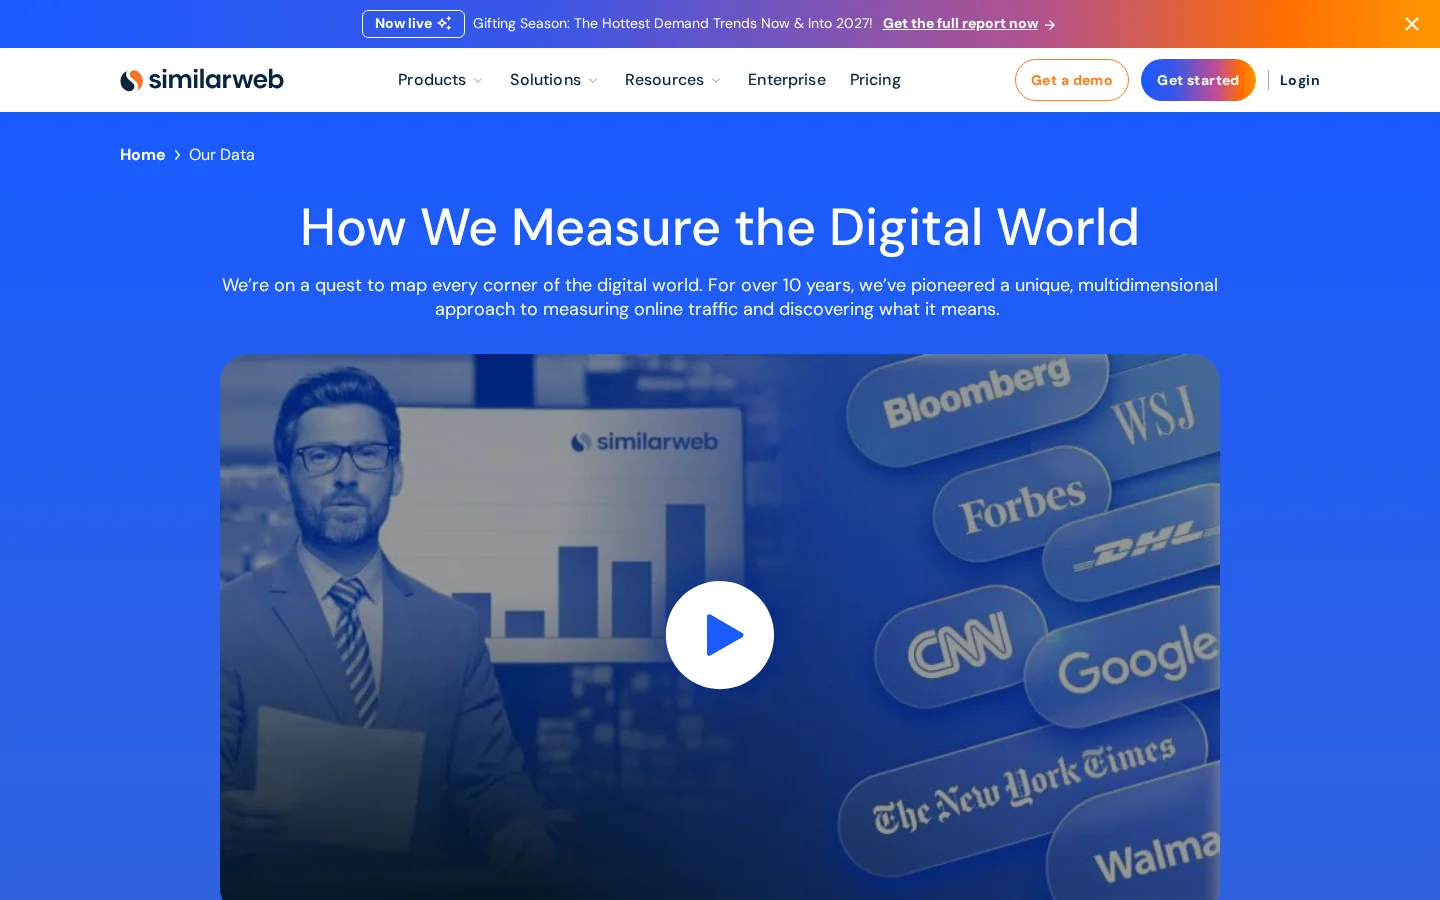
One month is noise. Look at several months of the same source for a domain, and ask one question: did the curve bend, and did it bend at the same time as a change you made or a change you saw in the market? A rise that starts when a competitor launches a new section tells you something. A spike in a single month usually tells you nothing.
Reading a traffic estimate
A model needs enough observations to separate a real change from noise. A site with little traffic gives it very little to work with, so the estimate can jump, flatten or disappear from month to month. If your site is small, the tool may tell you more about the big players than about you, and that is still useful for knowing who you compete with.
Pick a site where you know the real numbers, which is usually your own. Pull the monthly trend for the same months, then put it next to your Search Console clicks or your analytics sessions. If the two curves move in the same direction, the tool is usable for the competitors you cannot see. If they split, do not build a strategy on it.
This test costs nothing and takes one afternoon. It is the most useful check you can run before you pay.
Similarweb's homepage has a pricing link and a free trial, but it shows no prices. Third-party review pages describe the higher tiers as custom priced. Treat any figure you find online as unverified, and ask the sales team for the price in writing.
A sales call is a negotiation, and you are allowed to prepare for it. Bring the list of domains you want to analyse, the countries and languages you need, and the three or four questions your team will ask every week. Then ask the vendor to show those exact queries on a live account, not in a slide. If the demo cannot answer your questions with your own domains, the tool will not answer them after you sign either.
Ask for the trial to cover the same work you will do after the purchase. A short trial that only shows the homepage examples will tell you very little. Ask who owns the exports, whether you can keep the data after you cancel, and how support handles a wrong estimate on a site you know well.
Reviews on G2 and Capterra are mixed. Users praise the competitor data and the visual reports. They also mention price, limited report customisation and thin coverage of niche markets. Those are opinions, but they point at the same things you should check before a contract.
Before you sign a Similarweb contract
Warning
Some plans keep only a short history. If you cannot see last year's trend, you cannot compare this year with it. Export the data every month into your own sheet if the plan does not keep it for you.
This workflow gets real value from the tool without over-trusting it. Plan on about an hour per niche the first time, and much less afterwards, because the peer set stays the same.
The competitor check, in order
For step four, a keyword gap review does the scoring work. The keyword gap analysis guide walks through it, and the competitive content analysis guide shows how to turn the gaps into a plan. For step five, the backlink gap analysis method ranks the link prospects by value.
Once you have the list, a simple share ratio tells you how your traffic compares with a small peer group. Use it to track direction, not to publish a precise market share.
share(site) = visits(site) / sum of visits of all sites in the peer setKeep the peer set tight. Direct competitors in the same country and language make the ratio meaningful. A set that mixes a national media brand with a local shop makes the share almost meaningless.
Example
An online shop that sells running shoes picks its three closest rivals, all selling to the same buyers in the same country. It pulls several months of trends for each one. Two rivals grow steadily, and one drops after a site migration. The shop writes about the topics the growing rivals win, then checks its own Search Console clicks each month to confirm the plan works.
Most bad decisions made with Similarweb come from a handful of habits. The table gives the sign that gives each one away, and the sections below explain them in detail.
| Mistake | The sign | The fix |
|---|---|---|
| Treating an estimate as a count | A report quotes "visits" as sessions | Label it estimated and use analytics for your own sessions |
| Comparing unlike sites | Different countries, languages or business models | Keep the peer set to one market |
| Reading the Global Rank as quality | The rank appears in an authority argument | Use it as a size indicator only |
| Reacting to one month | A single spike drives a decision | Wait for several months of trend |
| Forgetting the history limit | A year-over-year check returns nothing | Confirm history depth before you buy, and export monthly |
| Overrating AI referrals | The AI slice looks big on a small base | Measure your own AI referrals and track the prompts that matter |
What it is: you read a modelled visit number as if it were the sessions in your analytics. How to spot it: a client deck or a team meeting quotes the figure as "our traffic" or "their real traffic". How to fix it: write "estimated" next to every figure, and keep your own numbers in Google Analytics and Search Console.
What it is: you put a national newspaper next to a neighbourhood bakery and draw a conclusion. How to spot it: the two domains differ in country mix, language or device split, or one of them is a marketplace and the other a single brand. How to fix it: keep the peer set to one country, one language and a similar business model.
What it is: you present a better rank as proof that a site is more authoritative. How to spot it: the rank sits next to words like "authority" or "trust" in your reports. How to fix it: describe it as estimated traffic size. For authority, look at the link profile instead, starting with the free backlink checker.
What it is: a spike or a dip in one month triggers a big decision. How to spot it: the change is not visible in your own data and does not repeat the next month. How to fix it: wait for several months, then check the same change in Search Console before you act.
What it is: you treat AI chatbot referrals as a main channel because a chart shows them prominently. How to spot it: the AI slice looks large, but the total base it sits on is small. How to fix it: measure your own AI referrals in analytics, and track the prompts that matter with an AI visibility audit.
Similarweb is one of four ways to read traffic. Each one answers a different question, and each one has a blind spot. Here is how they compare, one at a time.
Principle: a model combines panel, device and partner data into an estimate for any domain. When to use it: to size a market, to see who competes for the same audience and to compare the trend of several sites. Advantage: it covers sites you do not own. Limit: the figure is an estimate, and its quality drops for small or new sites. Example: you compare the trend of three rivals over several months and see that one of them is gaining ground in a category you ignore.
Principle: a tag on your own site records the visits, pages and events that really happen. When to use it: for your traffic, engagement and conversions. Advantage: it is measured, exact and yours. Limit: it says nothing about competitors. Example: you see that a page brings visits but few sales, which a market estimate could never tell you. The comparison of Google Analytics and Search Console explains how to split these jobs.
Principle: Google reports the clicks and impressions your site gets in Google search, by query and by page. When to use it: to check your own Google performance and confirm any trend you read elsewhere. Advantage: it is free and it comes from Google itself. Limit: it covers only your site, and its default view shows the past three months. Example: a competitor's estimated trend rises, and your Search Console clicks for the same keywords stay flat, which tells you the gain is not coming from search. Google's help page for the Performance report describes the four metrics: clicks, impressions, CTR and average position.
Principle: search volume and difficulty estimates are attached to each keyword, and they are used to rank topics by potential. When to use it: to decide which topics are worth an article before you write it. Advantage: it turns a list of ideas into a ranked plan. Limit: volumes are estimates too, and they say nothing about whether you can rank. Example: you have two topics with similar volume estimates, and you pick the one where the top results are weaker and your site already has related pages.
| Source | Principle | Use it for | Main limit |
|---|---|---|---|
| Similarweb estimate | Modelled panel, device and partner data | Market size and competitor trends | Estimates, weak for small sites |
| Your own analytics | Measured visits on your own site | Your sessions, engagement and conversions | Blind to competitors |
| Search Console | Google clicks and impressions for your site | Your performance in Google search | Only your site, default view covers three months |
| Keyword estimates | Volume and difficulty attached to each keyword | Ranking topics before you write | Estimates, and they do not predict your rank |
If your job is to keep up with what your competitors publish, Sorank's SEO spy tool watches the competitors you choose each week. It turns the keywords from their new pages into ideas in your editorial calendar, after a check against your own pages. It works from public pages, AI answers and search data, and it does not replace the market view that Similarweb gives you. The two can sit side by side.
Tip
Want a quick estimate before you open any paid tool? The free Organic Traffic Estimator forecasts monthly clicks from a keyword, which is a useful sanity check next to any traffic estimate.
If you need to choose a tool that measures your own visits, conversions and funnels, start from the best web analytics tools list. It covers the measured side, which is the side Similarweb cannot give you.
Which source answers which question
Both tools estimate the traffic of sites you do not own, but they start from different data. Similarweb models visits from panels, devices and partners, so it is strongest on market size and channel mix. Ahrefs estimates organic traffic from the keywords it sees a domain rank for, so it is strongest on which pages win a topic and which sites link to them. For a keyword or link question, start with Ahrefs. For a market or channel question, start with Similarweb.
Similarweb works from samples: browsing panels, device data and partner data are extrapolated to a whole domain. Ahrefs works keyword by keyword. For each keyword a domain ranks for, it applies an estimated search volume and an estimated click share for that position, then adds the results up. Neither method is measured, so both give you a direction, not a count. When the two tools disagree, check which input explains the gap before you act on it.
| Question | Similarweb | Ahrefs |
|---|---|---|
| How big is a niche? | Strong, with trends across sites | Useful, but only for sites that rank |
| Which channels bring a site's visits? | Strong: search, social, referrals and AI chatbots | Mainly organic search |
| Which keywords does a site rank for? | Estimated list | Keyword list with estimated positions |
| Which sites link to a domain? | Backlink analytics | Backlink index, page by page |
If your next step is a content or link plan, Ahrefs gives you a page-level view. You can see which keywords a competitor ranks for, the positions it holds and the pages that carry its links. Treat that list as a set of candidates. Check each keyword in Google before you write, because an estimated position is not a promise that you can rank there. The keyword gap analysis guide shows how to score the list by intent and fit.
If your question is about the market, Similarweb is the better first stop. It shows how traffic is split between search, social, referrals and AI chatbots, and how a niche moves over several months. Use that view before you decide whether a topic deserves a full section. Keep the peer set to one market, or the channel mix will mislead you.
Tip
Run the same competitor through both tools for the same months. If the direction matches, you have two sources you can trust. If they split, hold the conclusion until your own Search Console clicks settle it.
Most SEO teams need both views. Use Similarweb to choose the market and the competitors, then use Ahrefs to find the keywords and links behind them. Measure the result in Search Console, the one source here that reports your own clicks. You do not need both subscriptions on day one. Start with the tool that answers the question you have this month.
Buy it if you do market research, track many competitors across several markets or deliver market reports to clients, and if the quote fits your budget. It earns its cost when the question is "who wins this market, and how is it changing?"
Skip it if you only need your own traffic, since your analytics already gives you that. Skip it for a small site, where the estimates are weakest. Skip it if you want a tool that writes, publishes and fixes your pages, because Similarweb is an analysis product first.
| Buy it if | Skip it if |
|---|---|
| You need to see sites you do not own | You only need your own sessions |
| You track several markets at once | Your site is small or new |
| You report market trends to clients | You want execution, not analysis |
| The quote fits your budget | The quote does not fit, or the history depth is too short |
The short version: the tool is good at showing you the market and weak at showing you exact numbers. Read the trend, check it against your own data, and decide with both.
Similarweb's traffic figures are modelled estimates, built from panels, partner data and public signals, not from your own analytics. They are useful for comparing competitors and reading trends over several months. For an exact count of your own visits, rely on Google Analytics and Search Console instead.
Similarweb does not publish prices on its homepage, and third-party reviews describe its higher plans as custom priced. Ask the sales team for the price in writing, with the billing period, the number of seats and how far back the historical data goes. Then decide whether the answer you need justifies the cost.
It is strong for competitor and market research, because it shows traffic trends and channel mix for sites you do not own. It is weaker for small sites and for your own keyword positions. Pair it with Search Console, which reports your real clicks from Google.
We analyse your competitors, your website and your AI visibility to create a tailored content plan for free.
 AI Content Brief Generator
 FAQ Schema Generator
 AI Blog Post Ideas Generator
 Structured Data Validator (Schema Validator)
 Alt Text Checker
 Internal Link Analyzer
 Backlink Challenge
 AI Meta Description Generator
 AI Blog Title Generator
 Google Indexability Checker
 AI Blog Outline Generator
 UTM Link Builder
 Keyword Clustering Tool
 Canonical Tag Checker
 XML Sitemap Generator
 Broken Link Checker
 AI SEO Title Generator
 Headline Analyzer
 SERP Preview Tool
 Redirect Checker
 Hreflang Tag Generator
 Heading Structure Analyzer
 HTTP Headers Checker
 Favicon Extractor
 SERP CTR Calculator
 SEO vs Paid Search Savings Calculator
 SEO Share of Voice Calculator
 SEO ROI Calculator
 SEO Traffic and Revenue Forecast Calculator
 SEO Budget Calculator
 SEO Break-Even Calculator
 SaaS SEO ROI Calculator
 ROAS Calculator
 Reading Time Calculator
 Ranking Gain Simulator
 Organic Traffic Value Calculator
 Organic Traffic Estimator and Website Traffic Checker
 LTV to CAC Ratio Calculator
 Local SEO ROI Calculator
 Link Building Cost Calculator
 Keyword Value Calculator
 Keyword Opportunity Score Calculator
 Keyword Density Calculator
 GEO ROI Calculator
 GEO Content Investment Calculator
 Ecommerce SEO ROI Calculator
 Customer Lifetime Value Calculator
 Customer Acquisition Cost Calculator
 CTR Calculator
 Cost Per Article Calculator
 Conversion Rate Calculator
 Content Marketing ROI Calculator
 ChatGPT Referral Traffic Estimator
 Bounce Rate Calculator
 Backlink ROI Calculator
 AI Visibility Score Calculator
 AI Traffic Value Calculator
 AI Share of Voice Calculator
 Cost of AI Invisibility Calculator
 AI Citation Rate Calculator
 llms.txt Validator
 AI Overview Checker and AI Overviews Rank Checker
 Robots.txt Checker
 AI SEO Audit
 LLM Readability Checker
 SearchGPT Readiness Checker
 Structured Data LLM Audit
 Website Crawlability AI Audit
 Why ChatGPT Is Not Recommending My Website
 Gemini Ranking Tool
 Perplexity Ranking Checker
 LLM Citation Checker
 Answer Engine Optimization Audit
 GEO Audit
 AI Search Visibility Test
 ChatGPT Visibility Checker
 llms.txt Generator
 URL Extractor
 Webpage to Markdown
 Sitemap Checker
 SERP Volatility Sensor
 Page Size Checker
 Word Counter
 Slug Generator
 Schema Generator
 Robots Generator
 OG Preview
 Meta Tags Generator
 Image Compressor
 Favicon Generator
 On-Page SEO Audit: SEO Checker and SEO Analyzer
 Backlink Analysis Tool
 Keyword Research Tool
 Domain Authority Checker
 “I tested Sorank on a real client site and it's insane. It does everything an agency would bill you $1500 a month for. It's going into production on that client now.”

 Guillaume Guersanguersanguillaume.com“We are an Ads agency and we wanted to get our SEO back on track once and for all. Sorank gave us a clear view of our site, helped us prioritize optimizations, and properly structure our content. The tool is easy to use, well designed for a team, and very practical for centralizing tracking without having to juggle multiple platforms. A very solid foundation to start fresh with our SEO.”
 Gaspard MadouiAds Agency
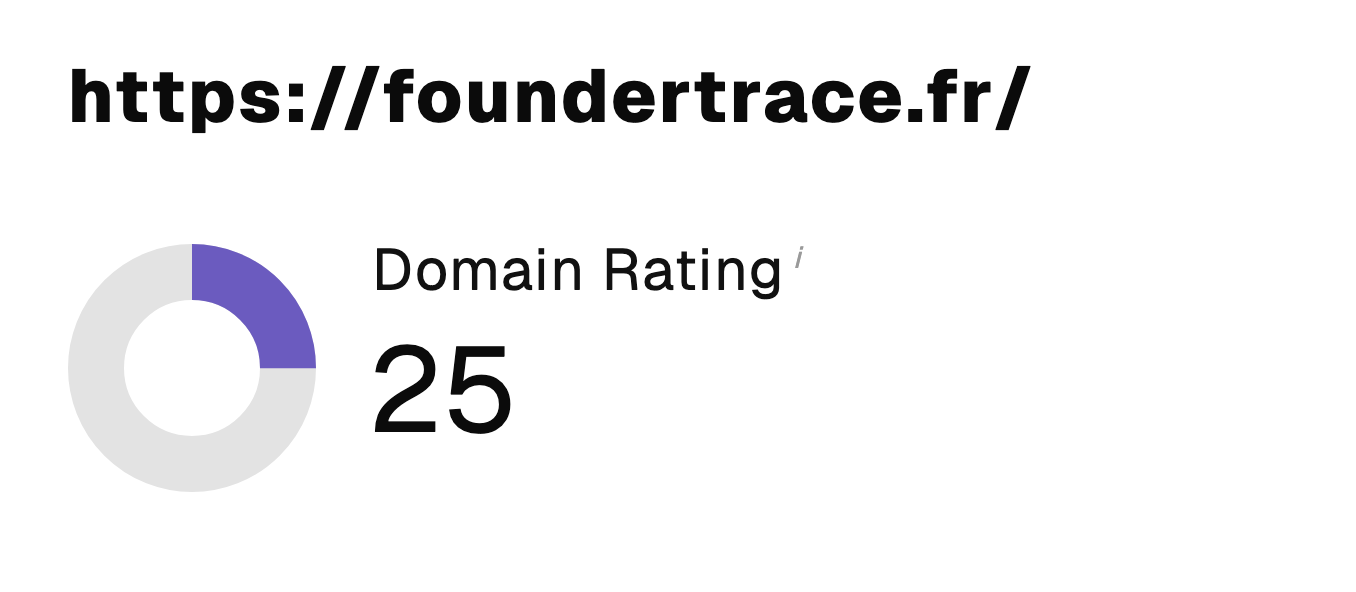 “I just let the Sorank software do its thing, and now my DR is 25 and my page is ranking higher.”
 Lucas Flandrefoundertrace.fr“I specialized in GEO thanks to Sorank. The GEO Leaderboard allows me to show my clients their position vs competitors on ChatGPT. It’s a real commercial differentiator.”
 MélanieSEO Freelance“Great service, works well for our website and helps us understand how to improve it to rank better on Google and elsewhere. Congrats, keep going, I recommend it.”
 Hugo T.E-commerce merchant