Preferences
Privacy is important to us, so you have the option of disabling certain types of storage that may not be necessary for the basic functioning of the website. Blocking categories may impact your experience on the website. More information
Privacy is important to us, so you have the option of disabling certain types of storage that may not be necessary for the basic functioning of the website. Blocking categories may impact your experience on the website. More information

 Google Search Console Report and Fix What It Shows
Learn to read every chart of the Crawl Stats report in Google Search Console, what it misses compared with server logs, and how to fix what it shows.

Tools

In short
The Crawl Stats report in Google Search Console shows how Googlebot requests your URLs: how many requests it sends, how many bytes it downloads, how fast your server answers, and which status codes it gets back. Read the host status first, then the response codes, then the purpose and file type breakdowns. The report is a summary, not a log, so use it to find the problem, then confirm it in your server logs.
Want to go further? Ask
Quick quiz
Who should fix the technical side of your site?
Our advice for you
Check it yourself with free Google tools
Search Console lists the pages Google cannot read, and PageSpeed Insights tests speed. Many small issues are fixed from your website builder settings.
Our advice for you
A web developer
Your problem is in the code or the server: a developer who knows SEO is the right person. Give them the list of errors from Search Console.
Our advice for you
A technical audit tool
Your site has many pages: a crawler reads them all like Google does and gives a full list of errors to fix, page by page.
Our advice for you
An automatic audit, then content
Your site works but brings few visitors: technical issues are rarely the cause. Sorank audits the site, then writes the pages that bring traffic.
Crawl Stats is a Google-side view of Googlebot's activity on your site. It tells you what Googlebot did, not why your pages rank or do not rank. Google describes the report as aimed at advanced users, and a site with fewer than a thousand pages may not need it at all. If you run a small brochure site, you can skip it until something changes.
Search Console is one product with many reports. Its public page covers crawling and indexing in general: sitemaps, URL Inspection, index coverage. Crawl Stats sits under Settings rather than in the main menu, which is why many people never open it.
The report is available only for root-level properties: a Domain property, or a URL-prefix property built on the root of the site. A property for a subfolder, such as example.com/blog/, does not get it. The data covers only the domain you select. Requests to sibling subdomains do not appear in another subdomain's report, but a parent domain view includes all its child domains. Both http and https count in the same view.
Note
If your site uses language subdomains such as en.example.com and de.example.com, open each one separately. Each has its own data, and a broken German subdomain does not show up in the English view.
Open the report when one of these is true: you publish many pages, you changed your URL structure or your hosting, Googlebot seems to visit less than before, or pages are discovered but never indexed. A site that adds a few articles a month has little to learn from it except errors, and those errors are better found in a normal crawl of the site.
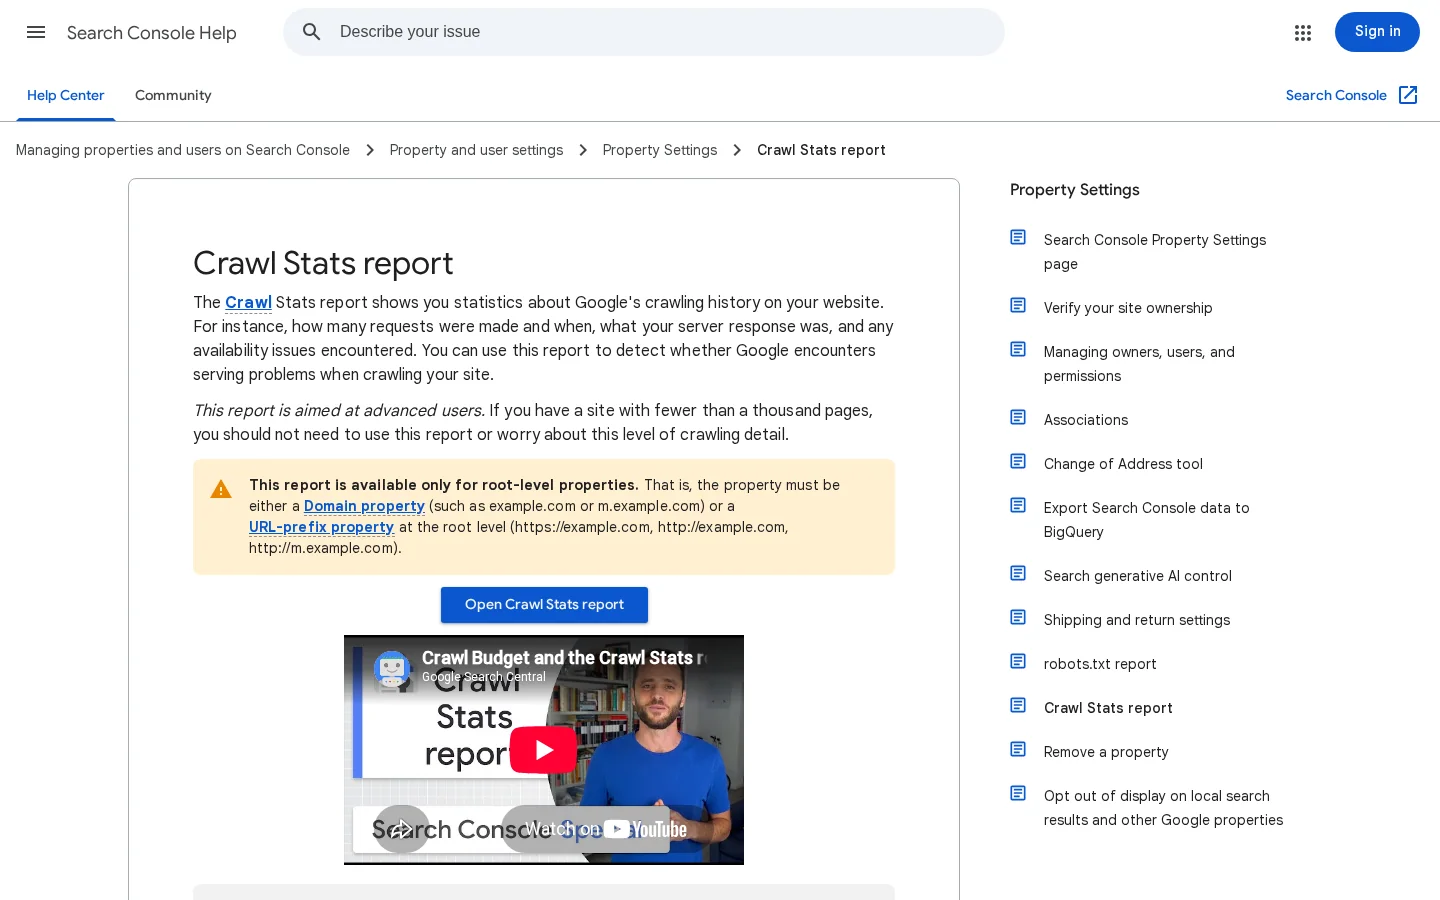
Open your property, go to Settings, find Crawl stats, and click Open report. At the top you get three charts: total crawl requests, total download size, and average response time. Below them you get the host status and four breakdowns: crawl responses, file type, crawl purpose, and Googlebot type. Every breakdown is a percentage based on request counts.
Here is what each part counts and how to read it.
| Part of the report | What it counts | How to read it |
|---|---|---|
| Total crawl requests | All requests for your URLs, successful or not, including failed DNS, connection and redirect-loop attempts. Attempts blocked by robots.txt are counted too. | A sudden drop or jump: check your robots.txt changes and your URL structure for the same dates. |
| Total download size | Bytes downloaded during crawling. A cached resource counts only on its first request. | Bytes rising while requests stay flat means your pages got heavier. |
| Average response time | The average time to fetch each resource, with each linked resource counted separately. | Read the trend, not one value. Watch it after each deployment. |
| Host status | Robots.txt fetching, DNS resolution and server connectivity. Green means no significant issue in the past 90 days, yellow means issues more than a week old, red means issues in the last week. | Any red or yellow item is a server or network problem before it is an SEO problem. |
| Crawl responses | The share of responses by type, based on request counts. | Track the share of bad responses over time. The raw count matters less. |
| File type | The share of responses by type: HTML, image, JavaScript, CSS, PDF, JSON, video. Based on response count, not bytes. | Shows where Googlebot spends its requests. Heavy JavaScript and CSS shares mean your pages depend on many resources. |
| Crawl purpose | Discovery (a URL Google had never crawled) or refresh (a recrawl of a known URL). | See the section on discovery and refresh below. |
| Googlebot type | Smartphone, Desktop, Image, Video, Page resource load, AdsBot, StoreBot, other. | On a site indexed mobile-first, Smartphone should be the largest group. A sudden shift deserves a check. |
Every breakdown counts requests. A URL that Googlebot fetches 50 times counts 50 times. So "40% of responses are 301" tells you how many requests hit a redirect, not how many URLs redirect. To learn which URLs are involved, you need your logs. The example URLs that Google shows are a sample, and Google says they are not comprehensive.
Google's help page says that the report currently reports most crawl requests, but some requests might not be counted. It also says that failed requests that never reach your server will not appear in your logs. That is why the report shows DNS and connection failures that your logs cannot show, and why you should read both sources. Google does not state a retention period for the charts, so save your own copy each month, with a screenshot or a short note of the numbers, if you want history.

The response breakdown is the part of the report that most often leads to a fix. Read it in this order, and stop at the first step that shows a real problem.
Triage the crawl responses in five steps
Google sorts the responses into three groups. The grouping is a first filter, not a verdict on each URL.
A 401 counts as bad in the report, but it is correct if the page sits behind a login that should stay closed. Decide URL by URL. The report tells you which group to look at, and you decide what each response should be.
A 302 counts as a good response, so a redirect share can look healthy while it still wastes crawling. In one analysis of a large site, published in April 2021 on Search Engine Journal by Tomek Rudzki of Onely, 16% of requests went to redirected pages, and the author advised checking each redirect hop.
Here is how a chain hurts. Suppose /blog/seo-tips redirects to /blog/seo-tips-2025, which redirects to /blog/seo-tips-guide. Googlebot needs three requests to reach the content, and every internal link that still points to the first URL repeats the cost. Point the first URL straight to the final address, and update the internal links so they stop using the old paths. The free redirect checker follows any URL's chain hop by hop, so you can see the path before you fix it. If you are not sure whether a redirect should be permanent, read our guide on 301 vs 302 redirects: a 301 says the move is permanent, a 302 says it is temporary.
Tip
Sort your redirect URLs by how often Googlebot requests them in your logs. Fix the five most requested chains first. They usually account for most of the redirect share.
Google's guide for large sites says that when a site responds with server errors (5XX) or rate-limiting signals such as HTTP 429, Google lowers its crawl rate limit. So a spike in 5XX costs you more than the broken URLs. It can slow the crawl of your healthy pages too. The crawl budget of a site depends partly on how well the server answers, and 5XX responses shrink that part.
When you see a 5XX spike, look at when it happens. Errors at the same hour each day point to a backup job, a scheduled import or a traffic peak. Errors right after a release point to the release. Errors spread across the whole day point to capacity. Each pattern has a different fix, and none of them is solved by editing a single page.
The crawl purpose breakdown splits requests into discovery, when Google sees a URL for the first time, and refresh, when it recrawls a URL it already knows. The ratio between them tells you what Google is spending its time on.
One large site, one crawl day
Source: Tomek Rudzki (Onely), Search Engine Journal, April 2021. One site of about 1 million pages, with a backlog of "Discovered, currently not indexed" URLs.
The same analysis made a useful rough check. At that pace, it estimated that the backlog would take roughly a year to crawl. That number is one author's calculation from one site, and the screenshots date from 2021, so do not copy it. The method still works on your own data: divide the number of URLs waiting to be discovered by the number of discovery crawls per day in your report. If the answer is measured in months, you have a crawl problem to fix before you publish more.
The file type breakdown counts responses, not bytes, so it shows how many requests go to each resource type, not how heavy they are. Redirects fall under "Other file type", and failed requests appear as "Unknown (Failed)". A growing share of Unknown (Failed) is a failure signal, not a file type, and you should treat it with the bad responses.
There are three ways to see what Googlebot did on your site: the Crawl Stats report, your server logs, and the URL Inspection tool in Search Console. Each answers a different question, and each has blind spots that the other two cover. For a real problem, use all three.
Principle: a summary of Googlebot's requests for a whole property, computed by Google. When to use it: for trends, host status, and the first overview of a problem. Advantages: it is free, it covers failures that never reach your server, and it adds purpose and Googlebot type, which logs do not give you directly. Limits: it is a summary, some requests may not be counted, and the example URLs are a sample. Example: the 5XX share rises for three days on one host. The report tells you the days and the host, and your logs tell you the URLs and the hours.
Principle: the raw record your web server writes for every request it receives. When to use it: to get exact URL lists, status codes by hour, and the evidence behind a report trend. Advantages: complete for every request that reached your server, with the exact URL and status code. Limits: they do not contain requests that failed before reaching the server, the user agent can be faked, and most servers rotate or delete logs after a set period. Here is a command that counts the status codes of requests identified as Googlebot in a combined-format log:
grep "Googlebot" access.log | awk '{print $9}' | sort | uniq -c | sort -rnThe command matches the user agent string, then counts the status code, which is the ninth field in the combined log format. If your server writes another format, change the field number. The result is a table of counts by status code, with the most frequent code first.
Warning
Anyone can send a request that claims to be Googlebot. Before you act on a suspicious spike, confirm that the IP addresses belong to Google. Google documents a reverse DNS check for this, and it is worth doing before you block or redirect anything based on the user agent.
Principle: a check on one URL, showing when Google last fetched it, what it received, and whether it is indexed. When to use it: to confirm one fix, for example whether Google fetched a corrected page after you changed it. Advantages: fast, exact and easy to read for a single URL. Limits: one URL at a time, so it cannot show a pattern across the site. In the analysis mentioned above, the tool showed that a main category page had not been crawled for three months, and the author used it as a stand-in for the logs on that page.
Crawl Stats report against server logs
| Method | Question it answers | Scope | Blind spot |
|---|---|---|---|
| Crawl Stats report | Is Googlebot healthy, and how is it behaving overall? | The whole property, summarized | Sampled example URLs, and some requests may not be counted |
| Server logs | Which exact URLs got which response, and when? | Every request that reached your server | Failed DNS and connection attempts, and user agents that can be faked |
| URL Inspection | When did Google last fetch this page, and what did it receive? | One URL | Says nothing about the rest of the site |
One month of data tells you little. The report becomes useful when you compare it with your own normal, so keep a short record and review it on the same day each month. This is the routine that works for most sites.
The monthly review in six steps
Signals that deserve action this month
Suppose you move your blog from /old-blog/ to /blog/ with 301 redirects. Right after the move, expect the redirect share to rise, because Googlebot still asks for the old paths. Over the following weeks, the share should fall as Google learns the new URLs. Expect the discovery share to rise too, since the new URLs are new to Google. If the redirect share stays high after several weeks, look for chains, for old internal links, or for redirects you forgot to add. Our guide to fixing broken links covers the link side of the same cleanup.
Most mistakes come from reading one chart as a verdict. Each of the five below has a clear sign that shows up in the report, and a fix that you can check in your logs.
What it is: assuming that more crawl requests mean better SEO. How to spot it: requests rise sharply after a release that added filter or sort options, and the new URLs carry parameters. How to fix it: check the discovery share and the URL patterns in your logs. Fix the URL generator: stop linking to parameter URLs, or canonicalize and block the ones that have no search value. A higher count of junk requests is a cost, not a gain.
What it is: looking at the average and missing the spikes it hides. How to spot it: the average looks flat, but your logs show slow responses at the same hour every night. How to fix it: group your logs by hour and by URL, then compare the slow hours with your backups, imports and deployments. Fix the slow job or the slow template, then check the average again. The average is a trend line, and a trend line cannot tell you where the slowness starts.
What it is: assuming the site is healthy because it opens in your browser. How to spot it: the host status shows yellow or red for robots.txt, DNS or connectivity, while your pages work for you. Googlebot reaches your site through different network paths, and a firewall, a CDN rule or a DNS record can block it without affecting your browser. How to fix it: check that your robots.txt file loads with a 200 response, using the robots.txt checker, then review your firewall and CDN rules for the dates when the status turned red.
What it is: a robots.txt change that cuts crawl requests, followed by a report that looks calmer. How to spot it: total requests fall sharply on the day of a robots.txt change. How to fix it: a drop can be correct if you blocked junk paths, but check that your important sections still get crawled. Look at the logs for the sections that matter. If a page you need is blocked, our guide to the blocked by robots.txt status explains how to find the rule and what to change.
What it is: treating a well-crawled page as an indexed page. How to spot it: Googlebot requests a URL regularly, but the URL does not appear in Google's results. A high crawl count does not prove that Google keeps the page. How to fix it: move from the Crawl Stats report to the page indexing reports and check the status of the URL. Our guide to crawled, currently not indexed explains the causes, and the guide to Google indexing covers the checks in order.
| Mistake | How to spot it | How to fix it |
|---|---|---|
| Total requests read as a score | Requests rise after URL parameters appear | Stop generating the junk URLs, then recount |
| Average response time alone | Slow hours hidden by a flat average | Group logs by hour, match slow hours to jobs |
| Host status ignored | Yellow or red while pages open in a browser | Check robots.txt, DNS, firewall and CDN rules |
| Crawl drop read as progress | Requests fall on a robots.txt change day | Confirm important sections are still crawled |
| Crawling confused with indexing | Regular crawls, URL missing from results | Check the indexing status of the URL |
Sorank's GEO / SEO dashboard puts your Search Console clicks, impressions, CTR and position next to the visits that AI assistants send you, read from Google Analytics. It does not show Googlebot's requests, so keep the Crawl Stats report for that job. The two tools answer different questions: the dashboard tells you what Google sends you, and Crawl Stats tells you how Google visits your server.
Tip
Before you spend time in your logs on a single page, check whether Google can index it at all with the free Google indexability checker. It answers the first question in seconds.
| What you see | Start with | Then open |
|---|---|---|
| Host status red or yellow | The robots.txt checker, then your DNS and hosting status | Server logs for the same dates |
| 5XX share rising | Your logs grouped by hour and URL | Server capacity, or the template that fails |
| Redirect share high | The redirect checker on the top URLs | Redirect chains and old internal links |
| Many URLs discovered, few indexed | The indexability checker on samples | Our log file analysis guide |
The Crawl Stats report is a good first screen. It tells you which kind of problem to suspect and on which dates. The fix almost always lives in a list of URLs, and that list is in your logs. Start with the report, then go to the URLs.
Open your property, go to Settings, select Crawl stats, then click Open report. The report exists only for Domain properties and root URL-prefix properties, so a subfolder property will not show it.
Not on its own. The total counts every request, including failed ones and attempts blocked by robots.txt, so it shows how much Googlebot visits, not how healthy those visits are. Read it next to the response codes and the average response time.
Not on its own. Google says some requests may not be counted and that its example URLs are not comprehensive. Use the report for trends and failure categories, and your logs for exact URLs.
We analyse your competitors, your website and your AI visibility to create a tailored content plan for free.
 AI Content Brief Generator
 FAQ Schema Generator
 AI Blog Post Ideas Generator
 Structured Data Validator (Schema Validator)
 Alt Text Checker
 Internal Link Analyzer
 Backlink Challenge
 AI Meta Description Generator
 AI Blog Title Generator
 Google Indexability Checker
 AI Blog Outline Generator
 UTM Link Builder
 Keyword Clustering Tool
 Canonical Tag Checker
 XML Sitemap Generator
 Broken Link Checker
 AI SEO Title Generator
 Headline Analyzer
 SERP Preview Tool
 Redirect Checker
 Hreflang Tag Generator
 Heading Structure Analyzer
 HTTP Headers Checker
 Favicon Extractor
 SERP CTR Calculator
 SEO vs Paid Search Savings Calculator
 SEO Share of Voice Calculator
 SEO ROI Calculator
 SEO Traffic and Revenue Forecast Calculator
 SEO Budget Calculator
 SEO Break-Even Calculator
 SaaS SEO ROI Calculator
 ROAS Calculator
 Reading Time Calculator
 Ranking Gain Simulator
 Organic Traffic Value Calculator
 Organic Traffic Estimator and Website Traffic Checker
 LTV to CAC Ratio Calculator
 Local SEO ROI Calculator
 Link Building Cost Calculator
 Keyword Value Calculator
 Keyword Opportunity Score Calculator
 Keyword Density Calculator
 GEO ROI Calculator
 GEO Content Investment Calculator
 Ecommerce SEO ROI Calculator
 Customer Lifetime Value Calculator
 Customer Acquisition Cost Calculator
 CTR Calculator
 Cost Per Article Calculator
 Conversion Rate Calculator
 Content Marketing ROI Calculator
 ChatGPT Referral Traffic Estimator
 Bounce Rate Calculator
 Backlink ROI Calculator
 AI Visibility Score Calculator
 AI Traffic Value Calculator
 AI Share of Voice Calculator
 Cost of AI Invisibility Calculator
 AI Citation Rate Calculator
 llms.txt Validator
 AI Overview Checker and AI Overviews Rank Checker
 Robots.txt Checker
 AI SEO Audit
 LLM Readability Checker
 SearchGPT Readiness Checker
 Structured Data LLM Audit
 Website Crawlability AI Audit
 Why ChatGPT Is Not Recommending My Website
 Gemini Ranking Tool
 Perplexity Ranking Checker
 LLM Citation Checker
 Answer Engine Optimization Audit
 GEO Audit
 AI Search Visibility Test
 ChatGPT Visibility Checker
 llms.txt Generator
 URL Extractor
 Webpage to Markdown
 Sitemap Checker
 SERP Volatility Sensor
 Page Size Checker
 Word Counter
 Slug Generator
 Schema Generator
 Robots Generator
 OG Preview
 Meta Tags Generator
 Image Compressor
 Favicon Generator
 On-Page SEO Audit: SEO Checker and SEO Analyzer
 Backlink Analysis Tool
 Keyword Research Tool
 Domain Authority Checker
 “I tested Sorank on a real client site and it's insane. It does everything an agency would bill you $1500 a month for. It's going into production on that client now.”

 Guillaume Guersanguersanguillaume.com“We are an Ads agency and we wanted to get our SEO back on track once and for all. Sorank gave us a clear view of our site, helped us prioritize optimizations, and properly structure our content. The tool is easy to use, well designed for a team, and very practical for centralizing tracking without having to juggle multiple platforms. A very solid foundation to start fresh with our SEO.”
 Gaspard MadouiAds Agency
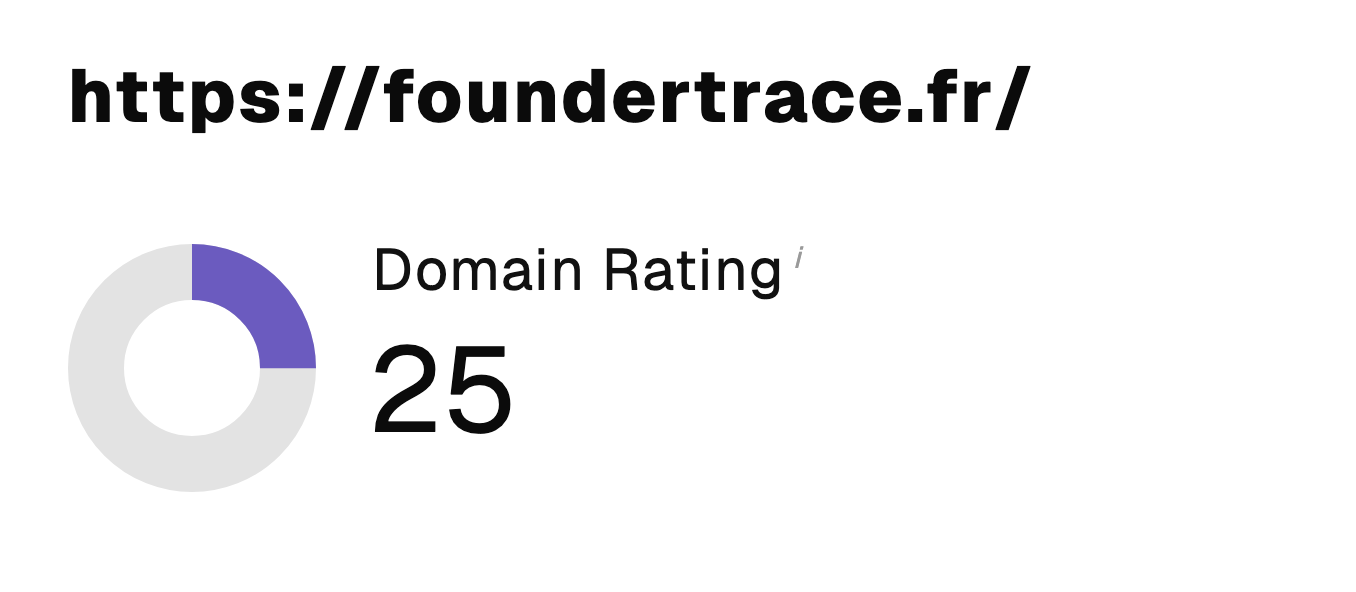 “I just let the Sorank software do its thing, and now my DR is 25 and my page is ranking higher.”
 Lucas Flandrefoundertrace.fr“I specialized in GEO thanks to Sorank. The GEO Leaderboard allows me to show my clients their position vs competitors on ChatGPT. It’s a real commercial differentiator.”
 MélanieSEO Freelance“Great service, works well for our website and helps us understand how to improve it to rank better on Google and elsewhere. Congrats, keep going, I recommend it.”
 Hugo T.E-commerce merchant