Preferences
Privacy is important to us, so you have the option of disabling certain types of storage that may not be necessary for the basic functioning of the website. Blocking categories may impact your experience on the website. More information
Privacy is important to us, so you have the option of disabling certain types of storage that may not be necessary for the basic functioning of the website. Blocking categories may impact your experience on the website. More information

Why AI search answers change on every run, how much they move, and how to measure your brand's presence across prompts instead of chasing one ranking.

Tools

In short
AI search volatility is how much the brands, URLs and order of an AI answer change from one run to the next, and from one week to the next. The same question can return a different brand list, different citations and a different order, because the answer is generated with randomness and the retrieval step changes too. A position inside an AI answer is therefore a poor metric. Measure how often your brand appears across many prompts and many runs, then build the sources that make your presence steady.
Want to go further? Ask
Quick quiz
How should you get mentioned by ChatGPT and other AI assistants?
Sorank matches your answers


Test it for 3 days on your own site and see where you stand on Google, ChatGPT and the other AIs.
Start 3-day free trial3 days free, then stop whenever you want. 90-day results guarantee, conditions apply.
In Google organic search, volatility means your position for a keyword moves up and down. In AI search, it means more than that. The answer itself is different on each run. A volatile AI answer can change in three ways: which brands it names, which URLs it cites, and the order it lists them in. Any of these can move without a single change on your website.
The difference matters because a ranking is a fixed output for a given moment. Google returns an ordered list, and for the same query in the same market that list is mostly repeatable. An AI model returns one sample from a range of possible answers. Your brand has a probability of appearing in that range. That probability is what you can measure, and it is what you can move.
Two numbers from a study published in 2026 show how strong the effect is. Rand Fishkin of SparkToro worked with Patrick O'Donnell of Gumshoe.ai. About 600 volunteers ran 12 prompts through ChatGPT, Claude and Google's AI, for 2961 runs in total. The researchers found less than a 1 in 100 chance that ChatGPT or Google's AI would return the same brand list twice. The chance of the same brand list in the same order was about 1 in 1000 runs. The SparkToro report, dated January 28, 2026, covers data collected in November and December 2025.
How stable are AI brand lists?
Source: SparkToro and Gumshoe.ai, January 2026
Once you accept that the output is a sample, the way you track it has to change. The comparison below sums up the two mindsets. It is the core idea of this whole guide.
Tracking a rank vs tracking presence
The most visible change is the brand list itself. A prompt such as "best project management tool for a 10-person team" can name five brands on one run and a different five on the next. Some brands come back often, others rotate in and out. Presence in the set is steadier than the position inside it, which is why the researchers advise tracking presence instead of rank.
This has a practical consequence. If you check a prompt once and see your brand in position two, you know almost nothing. If you check it 60 times and see your brand in 40 of the answers, you know something useful: you are a regular choice for that question.
Citations are the links an AI model shows as sources. They move even more than the brand list when the model runs a live web search, because each run can retrieve a different set of pages. A citation that disappears is not always a loss. Your brand may still be named in the text without a link. That is why you should track two things separately: the named mention and the cited URL.
Position inside an answer is the least stable element. An AI model may list your brand first in one run and fourth in the next, with no real change in how it sees you. Treat the order as noise unless it moves in one direction across dozens of runs.
Three mechanisms drive most of the change. You cannot switch them off, but knowing them tells you what to measure and what to ignore.
A language model does not pick one best answer. It picks each next word from a probability distribution. A setting called temperature controls how wide that choice is. At a low value the output is closer to repeatable, and at a high value it varies more. Developers can set temperature in an API, but the consumer apps most of your buyers use do not expose it. Assume sampling is always on. The SparkToro volunteers kept their usual settings, personalized or default, which is why their results describe what an ordinary user sees.
When an AI model searches the web, it does not send your exact question to a search engine. It rewrites the question into several sub-queries and retrieves pages for each one. A small change in wording, a page indexed that morning, or a different result for one sub-query can change which sources reach the final answer. The URLs you are cited from are the output of a retrieval step that moves. Our guide on how AI models choose their sources explains the mechanics, and Sorank's tracker of what AI really searches is built for exactly that question.
Providers update models and the systems around them without much notice. A new model version, a change in when an AI model decides to search, or a shift in the web index can change answers for a whole topic on one day. When your data shows a sudden step change, check for a likely update first, then compare it with your baseline before you react.
| Mechanism | What moves | How it shows up | What you do |
|---|---|---|---|
| Sampling | Brand list, wording and order | Different answers to the same prompt on the same day | Measure over many runs and report a share |
| Retrieval | Cited URLs | Different sources cited from one week to the next | Strengthen the pages and third-party sources that retrieve well |
| Model and index updates | Whole answer style and which brands are favored | A step change on a specific date | Keep a baseline and annotate every update you can identify |

Measured numbers are still scarce, and most of them come from SEO and AI visibility vendors. Two sources are worth reading closely. The first is a study by the SEO platform Authoritas, which compared AI Overviews with organic results. The second is a set of measurements from BrightEdge, which compared AI Overviews with AI Mode.
Authoritas measured ranking volatility with a score. The higher the score, the more the results changed over the period. For AI Overviews the score was 0.68 at 8 weeks and 0.73 at 13 weeks. For organic results it was 0.49 and 0.55. Digital Information World, which reported the study in February 2025, also said that about 70% of the AI Overview results changed within two to three months. That article did not state the keyword sample or the measurement dates, so check the original Authoritas report before you quote a figure in a client deck.
AI Overview results that changed within 2 to 3 months
Source: Authoritas study, reported by Digital Information World, February 2025
BrightEdge measured the same question from another angle. Its August 2025 analysis found 16.7% more volatility in brand mentions for AI Overviews than for AI Mode. It also found that AI Overviews kept 24% of their URLs unchanged, against 20% for AI Mode. The table puts these figures side by side.
| Measure | AI Overviews | Comparison | Source |
|---|---|---|---|
| Volatility score, 8 weeks | 0.68 | 0.49 for organic results | Authoritas |
| Volatility score, 13 weeks | 0.73 | 0.55 for organic results | Authoritas |
| Brand mention volatility | 16.7% higher | Compared with AI Mode | BrightEdge, August 2025 |
| URLs unchanged | 24% | 20% for AI Mode | BrightEdge, August 2025 |
AI Overviews appear inside the regular Google results page for a subset of queries. AI Mode is a separate, conversation-style interface. The BrightEdge figures suggest that AI Overviews swing more in the brands they mention, while AI Mode keeps fewer of its URLs stable. The practical lesson is to check each surface on its own. A single "Google AI" number hides the difference, and the difference is exactly what you need to plan around. Our comparison of Google AI Mode and AI Overviews covers what each one means for SEO.
The key point is that you cannot assume organic stability carries over. Organic results are less volatile than AI Overviews in the Authoritas data, but they are not still. A page that holds position 3 for a month can still drop after a core update, so you need a method that separates real change from ordinary movement on both surfaces.
Most rank trackers were built for Google, where a keyword has one ordered list that changes slowly. Applied to an AI model, the same logic produces a number based on one sample. If your brand is third in one run and eighth in the next, an average of those two runs tells you almost nothing. A tool that reports "you are number 3 in ChatGPT" is presenting one draw as a fact. Our rank tracking guide covers the classic method, and this article explains what changes once the answer is generated rather than listed.
The SparkToro conclusion is that rank-tracking products built on fixed positions are measuring noise. The advice from the study is to track presence instead of rank. It calls a visibility percentage a reasonable metric when it is measured across dozens to hundreds of prompts, each run several times. Ask any vendor to show the sample size and the method behind a score before you trust it.
One prompt, one screenshot vs a measured share
Google's own documentation points in the same direction, for a different reason. Google says a page must be indexed and eligible to appear in Search with a snippet to be used in AI Overviews or AI Mode. It also says there is no special markup or AI-specific file to add. There is no "AI ranking" setting to optimize, so the work is to be present and trusted across many sources, and to measure that presence honestly.
The method below takes a few days to set up and a few minutes a week to maintain. You can run it in a spreadsheet. Dedicated tools mostly save you the repetition, not the thinking.
The five-step measurement method
The visibility rate is the share of answers that name your brand. The margin of error tells you how much of a change is real. Use a 95% margin of error based on the standard error of a proportion:
visibility rate = answers that name your brand / total answers
standard error = sqrt(p x (1 - p) / n)     where p is the visibility rate and n the number of runs
95% margin of error = 1.96 x standard error
Here is an illustrative example, with made-up numbers rather than a measurement. Your brand appears in 37 of 80 runs, so the visibility rate is 46%. The standard error is 5.6 points, which gives a 95% margin of error of about 11 points. Report the result as 46% plus or minus 11 points. If the next batch shows 40%, that sits inside the range, and it is not a signal to rewrite your pages.
A brand can be named without a link, linked without being recommended, or recommended in a sentence that never names a competitor. Log these states separately: named and recommended, named only, and cited only. Their shares move for different reasons, and each one calls for a different fix. A citation without a mention is a sourcing problem. A mention without a recommendation is a positioning problem.
Your first measurement sheet
Note
Repeating every prompt by hand gets tedious after a few weeks. Sorank's AI Mention Tracking reports, for each prompt you track, how often ChatGPT, Claude and Gemini mention your brand, with the sources and the searches behind each answer. Its run is monthly, which is a thin sample for one prompt, so read its trend over several months and add your own repeated runs for the prompts that matter most.
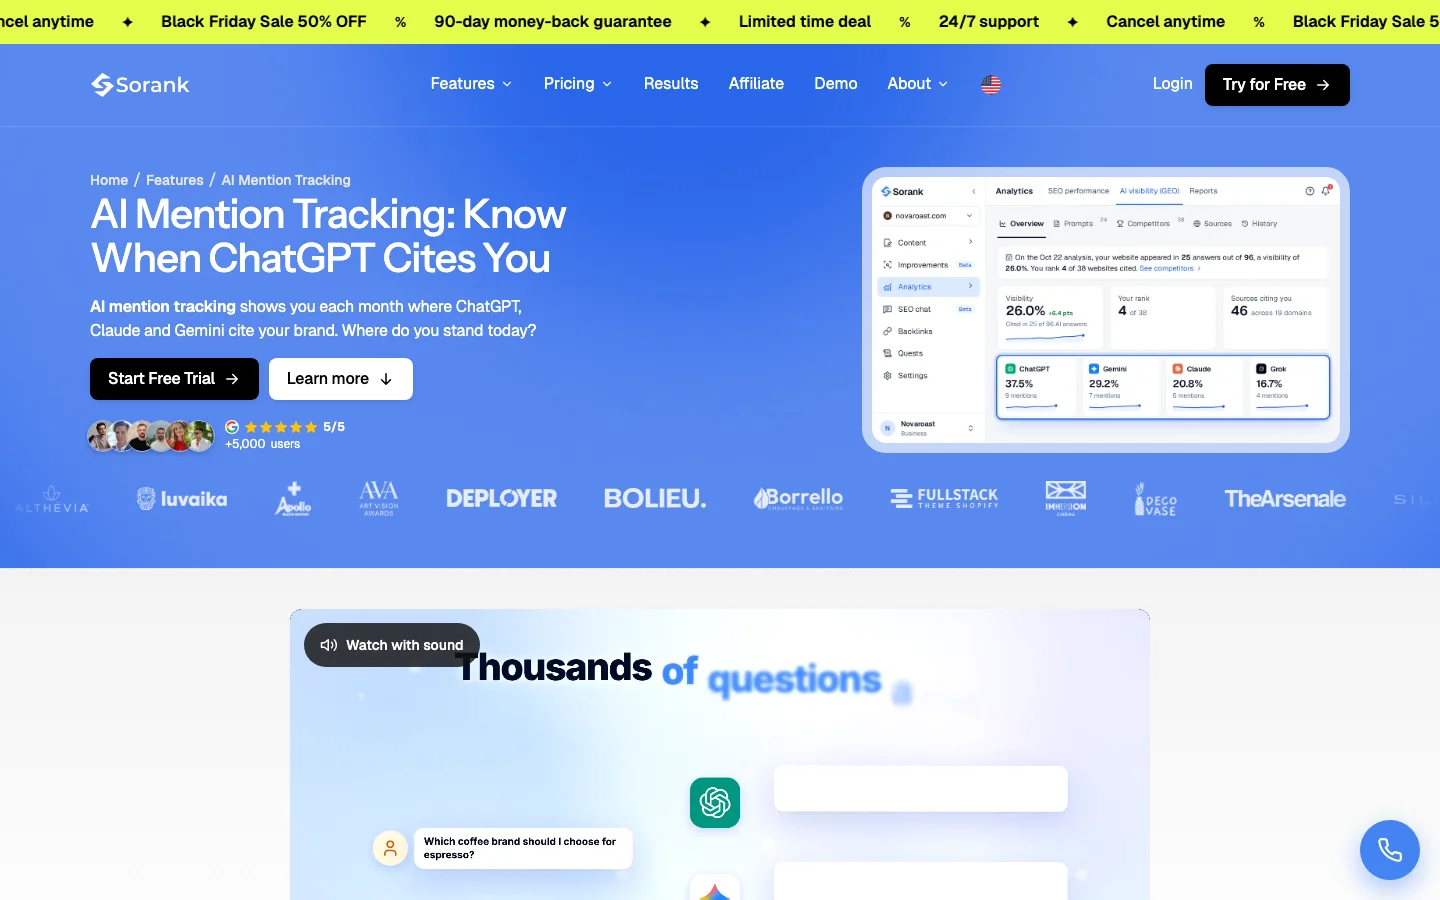
A monthly report should answer one question: is your presence moving, and is the move bigger than the noise? Show the visibility rate per prompt group with its margin of error, not a single figure. Add the position distribution, meaning how often your brand appears first, second or lower in the answers where it is named, so that order shows up as a spread rather than a rank. Bouncing around a flat or rising trend is normal. A steady fall over several batches is not, and it deserves a check of the prompts, the model release notes and the sources cited before anyone rewrites a page. Write the rule for action into the report itself: a change counts as real only when it passes the margin of error in two batches in a row.
You cannot switch volatility off, but you can make your presence more consistent. Presence grows when your brand is described the same way on several sources that AI models already use. Google's documentation gives the baseline for what its own AI features need.
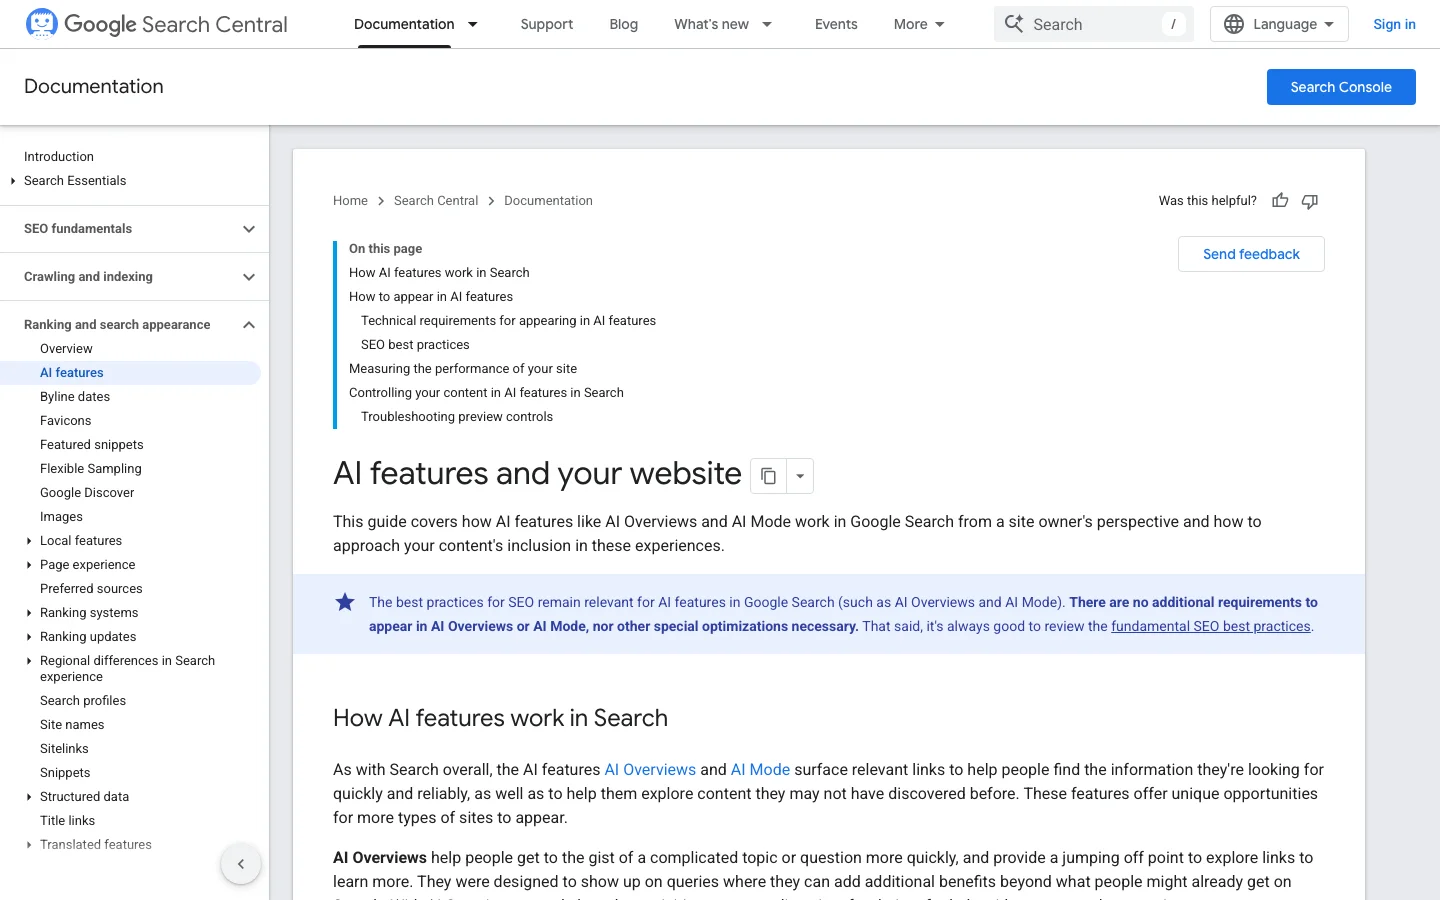
Google's guidance on AI Overviews and AI Mode is short. A page must be indexed and eligible to show a snippet. Standard fundamentals still apply: crawlable robots.txt rules, internal links, text content that is visible to readers, and structured data that matches the visible text. Google says you do not need new machine-readable files, AI text files or special schema to appear.
AI models build a picture of a brand from many places at once. If your name, category, main use case and location differ between your website, your profiles and your directory listings, the picture blurs, and the brand list becomes less stable. Write one short, factual description of your company, with the category and the use cases, and reuse it wherever you can control the text. Check it every quarter.
Corroboration means that several independent sources say the same thing about you. Reviews, comparison articles, industry directories and trade publications in your niche are the usual places. Earn these mentions through useful work, such as original data, a clear product comparison or a tool people actually use. Do not buy them. Paid placements add noise, and they are the kind of pattern that breaks as soon as the payments stop.
AI models extract passages, not whole pages. A page that gives a short definition in the first paragraph, a direct answer to the main question and a clear next step is easier to extract and easier to cite accurately. Our GEO checklist lists the points to check on each page.
Stability checklist for your brand
Teams react to volatility in four common ways. Each one has a use and a limit. Read them as options you can combine, not as a ranking of the best one. Most teams end up using the first and the last together.
Principle: query one prompt each day and record the position of your brand in the answer. When to use it: you want a quick early warning when one specific query changes sharply. Advantages: it is familiar, cheap and easy to chart. Limits: it is one sample per day, and it cannot separate a real loss from an ordinary draw. Example: a prompt names your brand on Monday and not on Wednesday. The chart shows a drop, but a single run cannot tell a lost position from a normal variation.
Principle: run many prompts many times and report the share of answers that name your brand, with its margin of error. When to use it: you need a number for reporting or a decision on content investment. Advantages: it matches how the output is generated and gives you a range instead of a false point. Limits: it costs more runs, and it requires discipline in keeping the prompt set stable. Example: your visibility rate is 46% plus or minus 11 points across 80 runs. Next month it is 52%. You can say the trend is up, but you cannot yet say it is a real gain, so you wait for another batch.
Principle: make the same accurate claims appear on several independent sources. When to use it: your positioning is clear and you want recommendations that hold up. Advantages: it helps in AI answers and in traditional search, and the effect lasts. Limits: it is slow, and it rarely shows a result within one month. Example: a software company gets its use cases described in two reviews, a comparison page and an industry directory, so AI models repeat the same description across different prompts.
Principle: update the pages that answer your main questions so the answer is clear, accurate and dated. When to use it: your page is cited but described wrongly, or a competitor's page is cited where yours should be. Advantages: it is quick to do and improves how passages are extracted. Limits: a better page does not guarantee a mention, and changes take time to show in your data. Example: a glossary page gets a one-sentence definition at the top, a short comparison table and a visible update note, and the next measurement batch shows the correct description.
| Method | What it tells you | Stability of the signal | Effort | Best for |
|---|---|---|---|---|
| Daily rank | One position on one day | Low | Low | Spotting a sharp move on one query |
| Presence across runs | Share of answers naming your brand | High, with a margin of error | Medium to high | Reporting and budget decisions |
| Corroboration | How consistently sources describe you | High over months | High | Long-term recommendations |
| Page refresh | How well your key pages answer the question | Medium | Medium | Fixing a wrong or missing description |
Google organic results and AI answers need different instruments. Mixing them up leads to wrong conclusions, so keep them apart in your reporting.
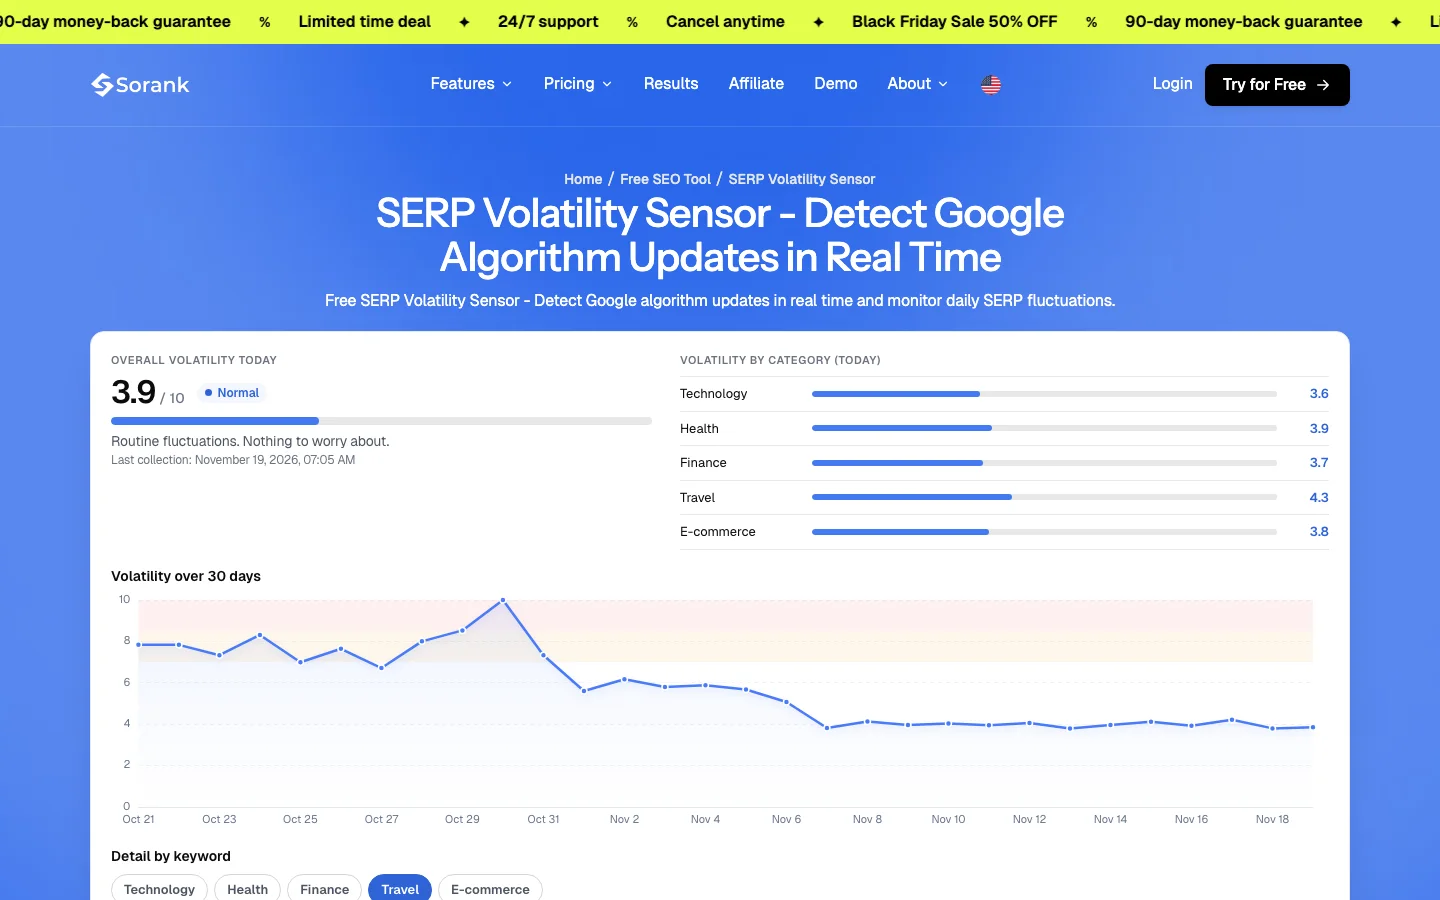
Sorank's free SERP Volatility Sensor covers the first kind. Each morning it collects the top 10 organic results for 20 English-language US keywords across five industries, compares them with the day before, and gives a score from 0 to 10, overall and per industry. It shows how much the first page of Google moved, which makes it a useful early signal for algorithm changes. It does not measure AI answers, so it does not replace the prompt-based method above. For the Google side of the question, read the sensor on its own page, and keep it next to your ranking data rather than next to your AI visibility numbers.
Search Console and Google Analytics report on Google clicks and referral visits. A rank tracker reports positions on Google. None of them shows which AI answers named your brand. For that you need logged answers or a tool that logs them. For visits that arrive from AI models, the referral side is covered in our guide to GEO reporting.
Most volatility mistakes come from reading noise as a signal. Each error below shows what it looks like, how to spot it in your data, and how to fix it.
What it is: one screenshot or one answer presented as your position. How to spot it: the report shows a position with no sample size, no date range and no margin of error. How to fix it: report the visibility rate across at least 30 runs per prompt, with the margin of error and the date range.
What it is: rewording a prompt between two checks, for example "best CRM" in one week and "best CRM for startups" in the next, and then reading the result as a trend. How to spot it: the prompt text in the spreadsheet differs between two dates for the same row. How to fix it: freeze the prompt set and version it. Add a new prompt as a new row and never edit an old one.
What it is: rewriting a page after a drop of five points. How to spot it: the change is smaller than the margin of error for that prompt. How to fix it: act only when a change exceeds the margin of error for two batches in a row, and write down what else changed in the same period, such as a model update or a competitor launch.
What it is: logging every link to your site as a win, even when the answer lists your brand as an option to avoid or as a footnote. How to spot it: nobody reads the sentence around the citation. How to fix it: log the three states separately (named and recommended, named only, cited only), and read the sentence before you tick the box.
What it is: prompts written by the marketing team for a report. How to spot it: the prompts use internal product names or jargon that customers never use. How to fix it: take prompts from sales calls, support conversations and Search Console queries, and check a few of them with real customers.
What it is: assuming that a higher visibility rate will automatically bring more visits. How to spot it: the visibility rate rises while referral sessions stay flat. How to fix it: measure referral visits separately, check which AI models and which pages send them, and connect the two datasets in one monthly report.
What it is: launching a project for an AI text file or new markup, expecting it to trigger citations. How to spot it: the project has no check on indexing or snippet eligibility. How to fix it: start with Google's guidance. Confirm that key pages are indexed and eligible to show a snippet, then fix the text and internal links before anything else.
| Mistake | Sign in your data | Fix |
|---|---|---|
| Single run reported as a result | No sample size or margin of error | Report a share across at least 30 runs |
| Prompts edited between checks | Same row, different text, different dates | Freeze and version the prompt set |
| Reacting inside the margin of error | Change smaller than the margin | Act on changes that persist for two batches |
| Citation counted as recommendation | No reading of the surrounding sentence | Log the three states separately |
| Prompts nobody types | Internal jargon in the prompt list | Source prompts from real customer language |
| Visibility treated as traffic | Rising visibility, flat referrals | Measure referrals on their own |
You do not need a full program to start. The first week is about setting up the measurement so that the next six months are readable. Take these steps in order.
Your first week
Once you have a baseline, volatility stops being a source of anxiety. It becomes a range you can measure, and a set of changes you can plan around.
Language models pick each word from a probability distribution, so the same prompt can produce different wording, brand lists and order. Retrieval also changes, because the AI model rewrites the question into sub-queries and the pages it retrieves can shift between runs.
Authoritas measured AI Overviews at a volatility score of 0.68 at 8 weeks and 0.73 at 13 weeks, against 0.49 and 0.55 for organic results. SparkToro found less than a 1 in 100 chance that ChatGPT or Google's AI returns the same brand list twice.
A single position in an AI answer is too unstable to act on. Track how often your brand appears across many prompts and runs, report that share as a percentage with its margin of error, and keep classic rank tracking for Google organic results, where positions move more slowly.
We analyse your competitors, your website and your AI visibility to create a tailored content plan for free.
 AI Content Brief Generator
 FAQ Schema Generator
 AI Blog Post Ideas Generator
 Structured Data Validator (Schema Validator)
 Alt Text Checker
 Internal Link Analyzer
 Backlink Challenge
 AI Meta Description Generator
 AI Blog Title Generator
 Google Indexability Checker
 AI Blog Outline Generator
 UTM Link Builder
 Keyword Clustering Tool
 Canonical Tag Checker
 XML Sitemap Generator
 Broken Link Checker
 AI SEO Title Generator
 Headline Analyzer
 SERP Preview Tool
 Redirect Checker
 Hreflang Tag Generator
 Heading Structure Analyzer
 HTTP Headers Checker
 Favicon Extractor
 SERP CTR Calculator
 SEO vs Paid Search Savings Calculator
 SEO Share of Voice Calculator
 SEO ROI Calculator
 SEO Traffic and Revenue Forecast Calculator
 SEO Budget Calculator
 SEO Break-Even Calculator
 SaaS SEO ROI Calculator
 ROAS Calculator
 Reading Time Calculator
 Ranking Gain Simulator
 Organic Traffic Value Calculator
 Organic Traffic Estimator and Website Traffic Checker
 LTV to CAC Ratio Calculator
 Local SEO ROI Calculator
 Link Building Cost Calculator
 Keyword Value Calculator
 Keyword Opportunity Score Calculator
 Keyword Density Calculator
 GEO ROI Calculator
 GEO Content Investment Calculator
 Ecommerce SEO ROI Calculator
 Customer Lifetime Value Calculator
 Customer Acquisition Cost Calculator
 CTR Calculator
 Cost Per Article Calculator
 Conversion Rate Calculator
 Content Marketing ROI Calculator
 ChatGPT Referral Traffic Estimator
 Bounce Rate Calculator
 Backlink ROI Calculator
 AI Visibility Score Calculator
 AI Traffic Value Calculator
 AI Share of Voice Calculator
 Cost of AI Invisibility Calculator
 AI Citation Rate Calculator
 llms.txt Validator
 AI Overview Checker and AI Overviews Rank Checker
 Robots.txt Checker
 AI SEO Audit
 LLM Readability Checker
 SearchGPT Readiness Checker
 Structured Data LLM Audit
 Website Crawlability AI Audit
 Why ChatGPT Is Not Recommending My Website
 Gemini Ranking Tool
 Perplexity Ranking Checker
 LLM Citation Checker
 Answer Engine Optimization Audit
 GEO Audit
 AI Search Visibility Test
 ChatGPT Visibility Checker
 llms.txt Generator
 URL Extractor
 Webpage to Markdown
 Sitemap Checker
 SERP Volatility Sensor
 Page Size Checker
 Word Counter
 Slug Generator
 Schema Generator
 Robots Generator
 OG Preview
 Meta Tags Generator
 Image Compressor
 Favicon Generator
 On-Page SEO Audit: SEO Checker and SEO Analyzer
 Backlink Analysis Tool
 Keyword Research Tool
 Domain Authority Checker
 “I tested Sorank on a real client site and it's insane. It does everything an agency would bill you $1500 a month for. It's going into production on that client now.”

 Guillaume Guersanguersanguillaume.com“We are an Ads agency and we wanted to get our SEO back on track once and for all. Sorank gave us a clear view of our site, helped us prioritize optimizations, and properly structure our content. The tool is easy to use, well designed for a team, and very practical for centralizing tracking without having to juggle multiple platforms. A very solid foundation to start fresh with our SEO.”
 Gaspard MadouiAds Agency
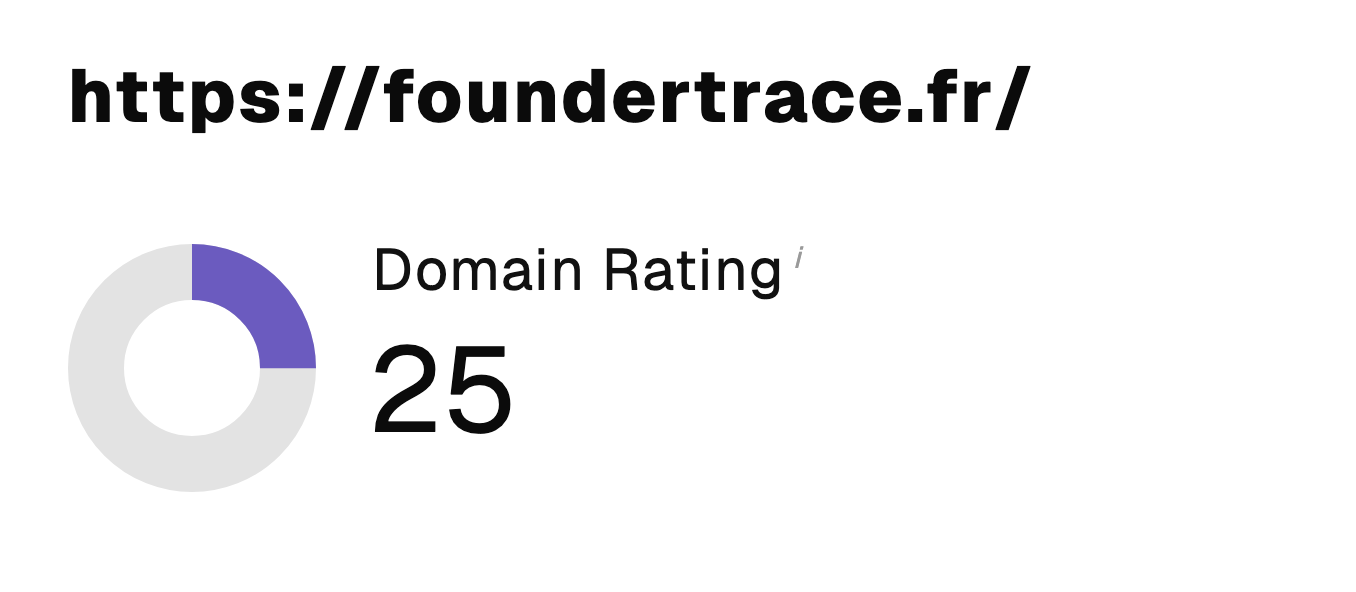 “I just let the Sorank software do its thing, and now my DR is 25 and my page is ranking higher.”
 Lucas Flandrefoundertrace.fr“I specialized in GEO thanks to Sorank. The GEO Leaderboard allows me to show my clients their position vs competitors on ChatGPT. It’s a real commercial differentiator.”
 MélanieSEO Freelance“Great service, works well for our website and helps us understand how to improve it to rank better on Google and elsewhere. Congrats, keep going, I recommend it.”
 Hugo T.E-commerce merchant