Preferences
Privacy is important to us, so you have the option of disabling certain types of storage that may not be necessary for the basic functioning of the website. Blocking categories may impact your experience on the website. More information
Privacy is important to us, so you have the option of disabling certain types of storage that may not be necessary for the basic functioning of the website. Blocking categories may impact your experience on the website. More information

 Search Console Generative AI Report: How to Read It and What to Do Next
Find out where the Search Console generative AI report lives, what its impressions mean, how to match it to clicks and which settings to check.


Tools

In short
The Search Console generative AI report shows how often links to your site appeared in Google's AI Overviews and AI Mode, broken down by page, country, device and date. It counts impressions only, so it tells you whether you were shown, not whether anyone clicked. To judge the value, compare its pages with the standard Performance report, where clicks from AI features appear under the Web search type.
Want to go further? Ask
Quick quiz
How should you use AI in your marketing?
Sorank matches your answers


Test it for 3 days on your own site and see where you stand on Google, ChatGPT and the other AIs.
Start 3-day free trial3 days free, then stop whenever you want. 90-day results guarantee, conditions apply.
Before this report, AI feature traffic sat inside the regular Performance report, with no separate view of which pages appeared in AI answers. The generative AI report fills that gap. It is a separate view of impressions from AI Overviews and AI Mode, and a Discover version covers generative AI features in Discover.
Google announced the Search generative AI performance reports on June 3, 2026, in a Search Central blog post written by Hillel Maoz (Search Ecosystem Engineering Manager) and Moshe Samet (Product Manager Lead, Search Console). The post describes the reports as covering "generative AI features on Search, such as AI Overviews and AI Mode." At launch, the reports went to a subset of websites. Google's help page now says that as of August 31, 2026, the insights reached all websites worldwide. If you did not see the report in June, check again before you assume your site is excluded.
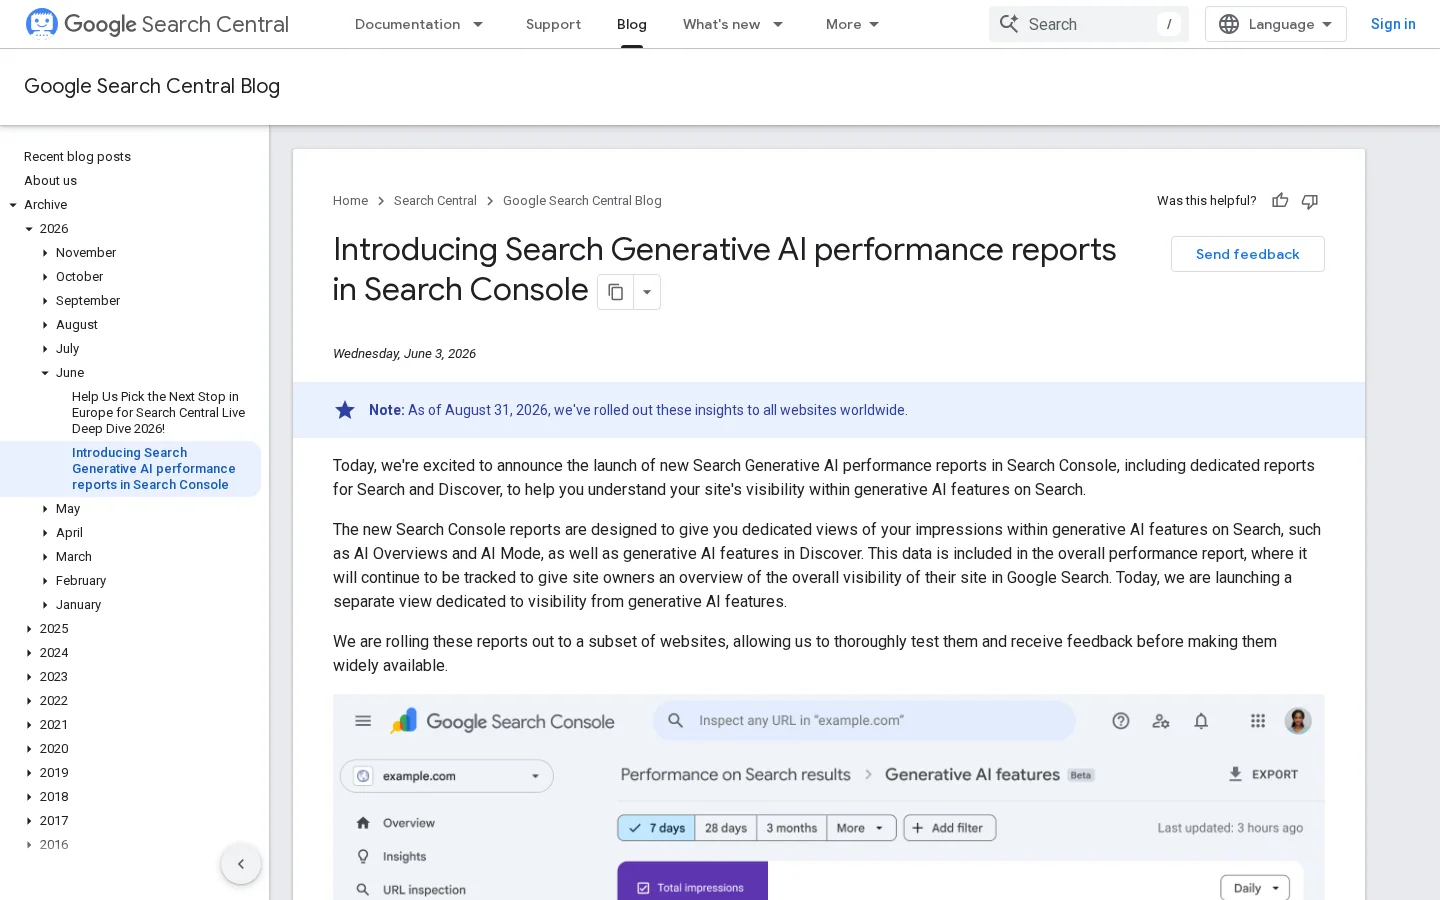
Key dates
Source: Google Search Central blog and Search Console Help
The dates matter for two reasons. First, the date range you can select is the real history you have, so check it before you plan a comparison with older periods. Second, Google says the newest data can be preliminary and can change, which affects any month you analyze too early.
Google also says it is considering "adding additional metrics over time." Today that means clicks and average position are not in this report. Plan around that instead of waiting for them.
This article covers the AI report and how it links to the standard Performance report. If you have not used Search Console much, read the Google Search Console beginner tutorial first. That page covers the basic reports, and this one assumes you can already find them.
Opening the report
Once the report is open, look at the chart before anything else. A dotted line marks preliminary data. Google says the newest data "can be preliminary, meaning it's still being collected and might change in the next few hours." Do not make decisions on the last day or two. In the export, values shown as "~" or "-" come out as zeros, so a row that looks empty may only be a placeholder.
Google says the report usually does not appear because your site has not received enough impressions in generative AI features on Google Search. The other cause is an exclusion. Sites excluded from Search generative AI features are not eligible for the report, and the exclusion setting is covered below. If neither applies, wait. The report is new, and a smaller site may simply have no AI impressions yet.
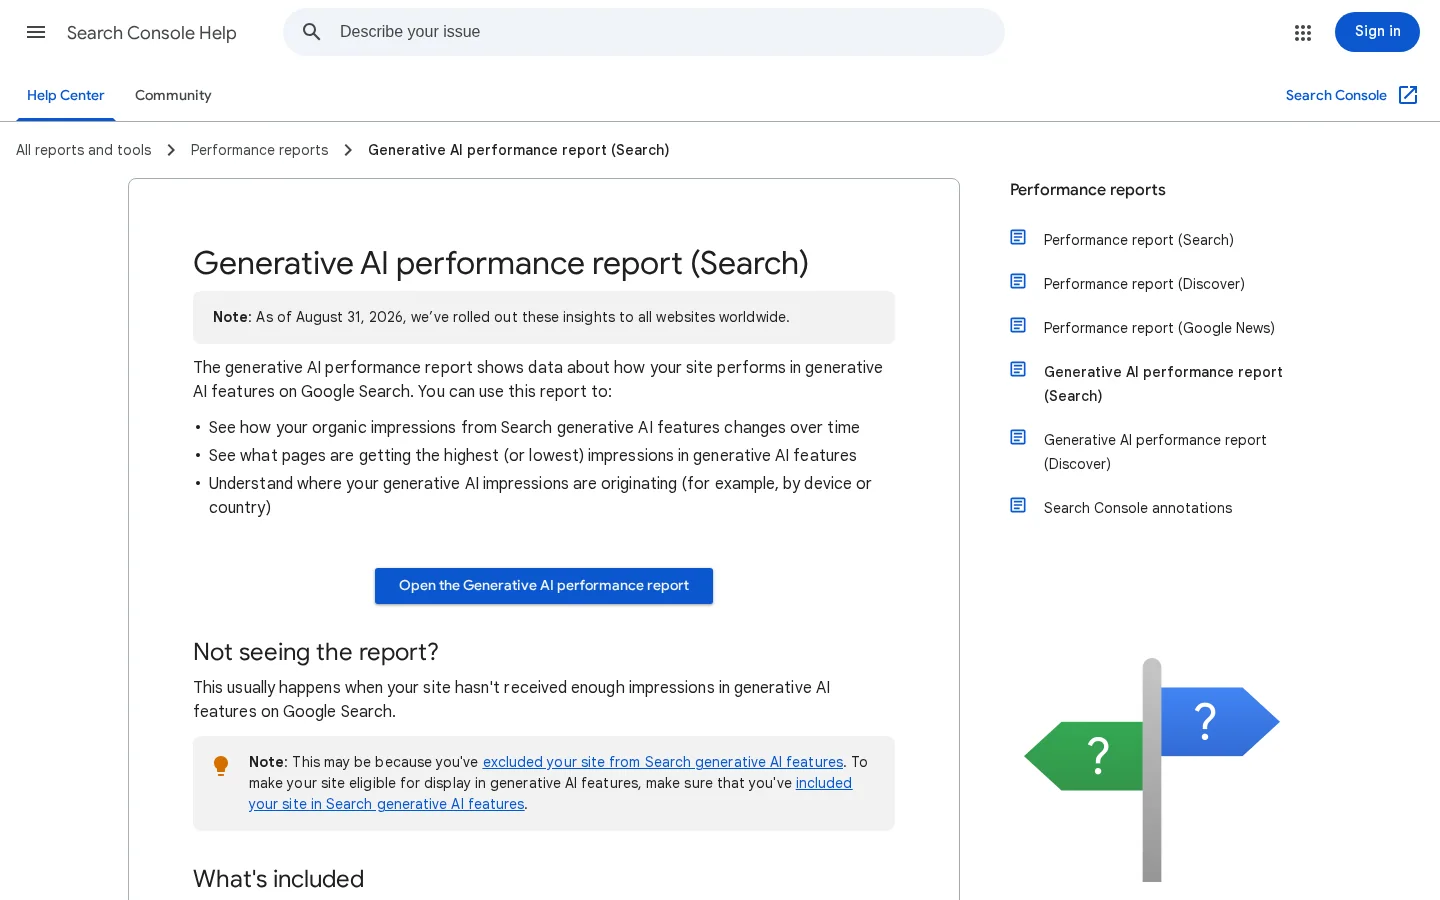
Google also says there is nothing extra to do to appear in these features. Its AI features documentation states that "There are no additional requirements to appear in AI Overviews or AI Mode, nor other special optimizations necessary." So the report is not a checklist of things to add. It is a way to see whether the pages you already publish are being used in AI answers, and for which queries and countries.

The metric is impressions. Google's help page defines it as "how many times links to your site were shown to a user in a generative AI feature on Google Search." An impression is a shown link. It is not a read, a click or a visit. Three details change how you read the numbers.
The chart total counts by property. If two links from your site sit in one AI answer, the chart counts one impression. The Pages tab counts by page. An AI answer that links two of your pages adds one impression to the chart, but one to each page row. So the page rows can add up to more than the chart total. Neither number is wrong. Choose one view for each question, and write down which one you used.
The search type filter splits the report into "Web: text-based" and "Web: multimodal." Text-based covers standard text queries. Multimodal covers image-based searches, such as Google Lens and Circle to Search. If people photograph the products you sell, a page may show up mainly in multimodal results. Check both types before you decide that a page does not matter in AI search.
The Countries tab groups impressions by where the search originated. The Devices tab covers desktop, tablet and mobile. For Discover, Google provides no device data, so do not compare Discover device splits with Search device splits. If you sell in several countries, the country tab is often more useful than the total. A page that is cited in one market and never in another often points to a language or local content gap, not a problem across the whole site.
Two reports, two questions
Source: Google Search Console Help, answer 16984139
The generative AI report tells you about exposure. It does not tell you about visits. Google's AI features documentation says that sites in AI features "are included in the overall search traffic in Search Console," and that their clicks are reported "in the Performance report, within the 'Web' search type." Clicks are not split out into their own line, so you need a second step to see which AI-cited pages gained or lost visits.
| Question | Generative AI report | Performance report, Web type |
|---|---|---|
| Was a page shown in an AI answer? | Yes, as impressions | Not as a separate figure |
| Did anyone click through? | No | Yes, within Web clicks |
| Which pages lost clicks over time? | No | Yes, by page and date |
| Are country and device splits available? | Yes, device data for Search only | Yes |
If you see falling clicks on a page with a strong AI share, the AI answer is not always the cause. Ranking changes, seasonality and core updates also reduce clicks. Our guide to AI Overviews traffic drops explains how to confirm the cause before you change the content. Whatever you measure, use clicks as the outcome that counts, and treat impressions as a sign of exposure.
The Pages tab groups by the final URL after redirects. If a page moved, check the redirect chain on the old and new addresses with the redirect checker before you match rows. Otherwise the AI impressions and the clicks can sit on different addresses, and the page will look as if it has no clicks at all.
Four methods are worth knowing. Each one answers a different question, so pick the one that matches the decision in front of you.
A raw impression count rarely tells you much on its own. A page with many AI impressions may be a small share of a large site, or the main source of visibility for a small one. Ratios and comparisons between the two reports tell you more. Start with the first method to build a shortlist, then use the second to test whether the shortlist is losing visits.
Principle. Divide a page's AI impressions by its total Web impressions over the same dates. The result shows how much of the page's visibility comes from AI answers.
When to use it. Use it first, when you want a shortlist of the pages most exposed to AI answers.
Advantages. You get one number per page, it sorts easily, and it works month after month.
Limits. The two exports are not built the same way, so the share is a ranking signal, not an exact percentage. A page with a high share and very few total impressions can look dramatic while being a small page.
Example. A glossary page where most of the impressions come from AI answers is a candidate for a clearer opening answer and a visible update date. That way a reader who clicks through sees why the page is current.
Principle. Find pages with a high AI share whose clicks fell over the same period. The page is visible inside answers, and the visits are going somewhere else.
When to use it. After a drop in clicks, when you need to know whether AI answers are part of the story.
Advantages. It points to the pages where an answer may be replacing the visit, instead of a general sense that AI is hurting traffic.
Limits. It shows a pattern, not a cause. A page can lose clicks for ranking reasons at the same time.
Example. Take two pages with the same AI share. If only one lost clicks while its average position held, the difference lies in the page, the query or the answer. That page is the one to study first.
Principle. Compare the AI report's country and device splits with the same splits in the Performance report, for the same pages.
When to use it. When you sell in several markets, or when most of your audience reads on mobile.
Advantages. It shows where AI visibility is strong and where it is missing, which points to language or local content gaps.
Limits. The AI report has device data for Search only and no clicks, so you still need the Performance report for outcomes.
Example. A page that appears in AI features for one country and never for another is often a question about that market's version of the page.
Principle. Compare the "Web: text-based" and "Web: multimodal" search types for the same pages.
When to use it. When your pages carry images that people search for, such as products, recipes or diagrams.
Advantages. It shows visual demand that a text-only review misses.
Limits. The report counts impressions only, and it does not tell you which image was used.
Example. A product page that appears only in multimodal results is a signal to check its image file names, alt text and image quality before you rewrite its headline.
| Method | Question it answers | Data needed | Main limit |
|---|---|---|---|
| AI share by page | Which pages are most exposed to AI answers? | AI report and Performance report, same dates | Exports are not built the same way |
| Cited but not clicked | Where did clicks go as AI exposure grew? | Both exports for two periods | Shows a pattern, not a cause |
| Country and device comparison | Where is the page visible, and where not? | Splits from both reports | No clicks in the AI report |
| Text versus multimodal | Do image searches bring AI impressions? | AI report by search type | Impressions only |
Run this routine once a month, with the same date range each time. Leave out the most recent days, since they are still preliminary. Save both exports in a folder, with the date range in the file name, so anyone on the team can rebuild the numbers later.
The monthly routine
AI share (page) = AI impressions / Web impressions, same URL, same dates

Spreadsheet, with C = AI impressions and D = Web impressions:
=IFERROR(C2/D2, 0)
Read the result as a ranking. If a share comes out above 100%, the two exports disagree on that URL. Check the redirect and the dates before you use that row. Also run the routine for several months before you draw conclusions, because one month can show a spike that disappears the next.
In Search Console, go to Settings, then Search generative AI. From there you can exclude your site's links and content from AI Overviews, AI Mode and the generative AI features in Discover. Google's help page on this control says content is excluded "within 1-2 days after the control goes live," although caching and propagation can make it take longer. While a site is excluded, it gets no traffic or impressions from these features.
Excluding is a business decision, not an SEO fix. Google says the control "isn't used as a ranking or inclusion signal affecting other parts of Search," and that it does not affect AI training. Before you change it, use the report to see what you would give up. The help page says the report can show how a change might affect traffic.
| Control | Where you set it | What it affects | Side effect |
|---|---|---|---|
| Search generative AI exclusion | Settings, then Search generative AI | AI Overviews, AI Mode and Discover AI features | None on other Search results, according to Google |
| robots.txt for Googlebot | robots.txt file | Crawl access | Blocked pages cannot be crawled. See our robots.txt guide |
| nosnippet or max-snippet | Page HTML or HTTP headers | How much text Google can show | Shortens or removes snippets in regular results too |
| noindex | Page HTML or HTTP headers | Whether the page appears in Search at all | Removes the page from all Search results |
The site-wide exclusion is the only setting that covers AI features as a whole. The snippet controls are set page by page, but they also change how your page appears in regular results.
Warning
Do not add nosnippet to protect clicks. It removes the text Google can show in regular results, so you trade AI impressions for lost search snippets. The tag below is the one to avoid copying by mistake.
<meta name="robots" content="nosnippet">These are the mistakes to check for first. For each one, you will see what it is, how to spot it and how to fix it.
What it is. Reading the AI report as a traffic report, and planning visits from the impression column.
How to spot it. A forecast or a team goal uses AI impressions as a visitor count, or someone calls the report "AI traffic."
How to fix it. Label the figure "AI impressions" in every document. For visits, use clicks from the Performance report, Web type, and say so in the note.
What it is. Adding up the Pages tab and expecting it to match the chart.
How to spot it. The page rows add up to a different number from the chart, and someone decides the export is broken.
How to fix it. Write the counting rule in your notes. The chart counts by property, while the Pages tab counts each URL. Report which view you used.
What it is. Switching off AI features after clicks fall, on the theory that this will bring them back.
How to spot it. AI impressions drop to near zero after a settings change, and nothing else on the site changed.
How to fix it. If the change was not a deliberate decision, reverse it. Then use the cited-but-not-clicked method to find the pages that need work. The control removes you from the feature. It does not improve the page.
What it is. Deciding on a page after a few days of data.
How to spot it. The chart ends in the dotted preliminary line, and the decision rests on the last few days.
How to fix it. Wait for complete months, leave out the most recent days, and compare the same period in both reports.
What it is. Joining the two exports on URL text without checking whether a page moved.
How to spot it. A page has AI impressions and zero clicks, and it recently changed address.
How to fix it. Check the redirect chain with the redirect checker, then match on the final address in both exports.
Before you act on the report
The report covers Google only. It shows AI Overviews and AI Mode, plus the Discover version for Discover. It does not show ChatGPT, the Gemini app, Claude or Perplexity. If those assistants matter to your buyers, you need another check. Our AI visibility audit guide explains a manual test across assistants, and the AI mention tracking page covers how to follow citations over time.
| Surface | In the Search Console report? | Where to check |
|---|---|---|
| Google AI Overviews | Yes | Generative AI performance report (Search) |
| Google AI Mode | Yes | Generative AI performance report (Search) |
| Generative AI in Discover | Yes, in a separate report | Generative AI performance report (Discover) |
| ChatGPT, Claude, Perplexity, Gemini app | No | Manual prompt tests or a tracking tool |
Sorank's GEO / SEO dashboard puts Google and AI traffic side by side in one view, which helps when you want both reports in front of you at the same time.
Tip
To check whether Google already cites a given page in its AI answers, run the free AI Overview Checker. Use it on a page from your shortlist before you rewrite that page.
Use this table to turn the patterns into a first action. These are likely causes, not proof, so confirm them in the standard Performance report before you rewrite a page.
| Pattern | Likely cause | First action |
|---|---|---|
| High AI share, clicks stable | The page is cited and still earns visits | Keep the page. Add examples, tools or detail that the answer does not give |
| High AI share, clicks falling | The answer may cover the basic question | Give the reader the next step, such as a template, a calculator or a deeper case |
| Low AI share, clicks falling | Probably a ranking or demand change, not AI | Check positions and the standard Performance report first |
| AI impressions on a page you did not expect | Google chose the page as a source for a topic | Check the facts, the date and the summary at the top of the page |
Then do one thing this week. Pick the single page with the highest AI share and falling clicks, and check whether its opening answers the question the reader came with. If you want more on earning citations in AI Mode, read Google AI Mode SEO, then compare the two AI surfaces in AI Mode vs AI Overviews.
It sits in the Performance section, under Generative AI performance report (Search). It covers AI Overviews and AI Mode, and Google says it reached all websites worldwide as of August 31, 2026.
No. It shows impressions only, meaning how often links to your site were shown in an AI feature. Clicks from AI features still appear in the standard Performance report, under the Web search type.
No. It only covers Google's generative AI features in Search and Discover. To check other assistants, run manual prompt tests or use a tracking tool.
We analyse your competitors, your website and your AI visibility to create a tailored content plan for free.
 AI Content Brief Generator
 FAQ Schema Generator
 AI Blog Post Ideas Generator
 Structured Data Validator (Schema Validator)
 Alt Text Checker
 Internal Link Analyzer
 Backlink Challenge
 AI Meta Description Generator
 AI Blog Title Generator
 Google Indexability Checker
 AI Blog Outline Generator
 UTM Link Builder
 Keyword Clustering Tool
 Canonical Tag Checker
 XML Sitemap Generator
 Broken Link Checker
 AI SEO Title Generator
 Headline Analyzer
 SERP Preview Tool
 Redirect Checker
 Hreflang Tag Generator
 Heading Structure Analyzer
 HTTP Headers Checker
 Favicon Extractor
 SERP CTR Calculator
 SEO vs Paid Search Savings Calculator
 SEO Share of Voice Calculator
 SEO ROI Calculator
 SEO Traffic and Revenue Forecast Calculator
 SEO Budget Calculator
 SEO Break-Even Calculator
 SaaS SEO ROI Calculator
 ROAS Calculator
 Reading Time Calculator
 Ranking Gain Simulator
 Organic Traffic Value Calculator
 Organic Traffic Estimator and Website Traffic Checker
 LTV to CAC Ratio Calculator
 Local SEO ROI Calculator
 Link Building Cost Calculator
 Keyword Value Calculator
 Keyword Opportunity Score Calculator
 Keyword Density Calculator
 GEO ROI Calculator
 GEO Content Investment Calculator
 Ecommerce SEO ROI Calculator
 Customer Lifetime Value Calculator
 Customer Acquisition Cost Calculator
 CTR Calculator
 Cost Per Article Calculator
 Conversion Rate Calculator
 Content Marketing ROI Calculator
 ChatGPT Referral Traffic Estimator
 Bounce Rate Calculator
 Backlink ROI Calculator
 AI Visibility Score Calculator
 AI Traffic Value Calculator
 AI Share of Voice Calculator
 Cost of AI Invisibility Calculator
 AI Citation Rate Calculator
 llms.txt Validator
 AI Overview Checker and AI Overviews Rank Checker
 Robots.txt Checker
 AI SEO Audit
 LLM Readability Checker
 SearchGPT Readiness Checker
 Structured Data LLM Audit
 Website Crawlability AI Audit
 Why ChatGPT Is Not Recommending My Website
 Gemini Ranking Tool
 Perplexity Ranking Checker
 LLM Citation Checker
 Answer Engine Optimization Audit
 GEO Audit
 AI Search Visibility Test
 ChatGPT Visibility Checker
 llms.txt Generator
 URL Extractor
 Webpage to Markdown
 Sitemap Checker
 SERP Volatility Sensor
 Page Size Checker
 Word Counter
 Slug Generator
 Schema Generator
 Robots Generator
 OG Preview
 Meta Tags Generator
 Image Compressor
 Favicon Generator
 On-Page SEO Audit: SEO Checker and SEO Analyzer
 Backlink Analysis Tool
 Keyword Research Tool
 Domain Authority Checker
 “I tested Sorank on a real client site and it's insane. It does everything an agency would bill you $1500 a month for. It's going into production on that client now.”

 Guillaume Guersanguersanguillaume.com“We are an Ads agency and we wanted to get our SEO back on track once and for all. Sorank gave us a clear view of our site, helped us prioritize optimizations, and properly structure our content. The tool is easy to use, well designed for a team, and very practical for centralizing tracking without having to juggle multiple platforms. A very solid foundation to start fresh with our SEO.”
 Gaspard MadouiAds Agency
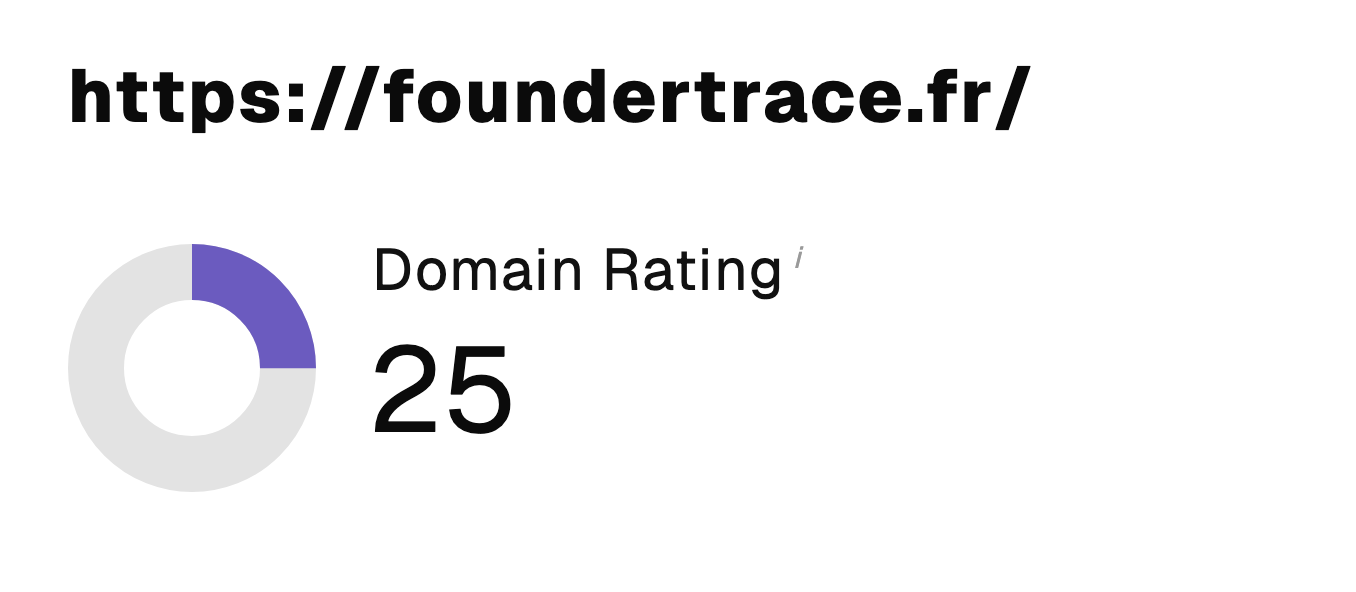 “I just let the Sorank software do its thing, and now my DR is 25 and my page is ranking higher.”
 Lucas Flandrefoundertrace.fr“I specialized in GEO thanks to Sorank. The GEO Leaderboard allows me to show my clients their position vs competitors on ChatGPT. It’s a real commercial differentiator.”
 MélanieSEO Freelance“Great service, works well for our website and helps us understand how to improve it to rank better on Google and elsewhere. Congrats, keep going, I recommend it.”
 Hugo T.E-commerce merchant