Preferences
Privacy is important to us, so you have the option of disabling certain types of storage that may not be necessary for the basic functioning of the website. Blocking categories may impact your experience on the website. More information
Privacy is important to us, so you have the option of disabling certain types of storage that may not be necessary for the basic functioning of the website. Blocking categories may impact your experience on the website. More information

Customer journey mapping step by step: set one goal, research real buyers, choose stages from evidence, attach pages and KPIs, and avoid the common mistakes.

In short
A customer journey map shows every step a buyer takes, from the first problem to the purchase and beyond, with what they think, feel and do at each step and where they meet your business. Build it from real evidence (buyer interviews, sales and support notes, search data, and the questions people ask AI assistants), keep one goal and one persona per map, then attach a page, an action and a metric to each stage. Rebuild it when your offer or your traffic sources change.
Want to go further? Ask
Quick quiz
Which way of finding customers online fits you best?
Sorank matches your answers


Test it for 3 days on your own site and see where you stand on Google, ChatGPT and the other AIs.
Start 3-day free trial3 days free, then stop whenever you want. 90-day results guarantee, conditions apply.
A customer journey map is a visual record of how one type of customer moves toward a decision. It lists what the customer does, what they ask at each point, what they feel while doing it, and the places where they touch your business. The Nielsen Norman Group, a user research firm, describes the method as a timeline of user goals and actions, filled in with thoughts and emotions until it becomes a narrative. Its guide on creating journey maps (Kate Kaplan, 2016) says a map should "always be created to support a known business goal." That single rule is where a good map starts.
Most teams already own three tools that look similar. Keep them apart, because each one answers a different question.
| Tool | What it describes | Question it answers |
|---|---|---|
| Persona | One representative buyer: role, goals, objections | Who are we talking to? |
| Marketing funnel | How many people move between stages, and where they drop | How many people move on, and where do they stop? |
| Customer journey map | The actions, thoughts and emotions of one persona toward one goal | What does the buyer go through, and where does it break? |
| Content map | Each existing page assigned to a persona and a stage | Which page should answer which step? |
The four tools feed each other. A persona gives the map its point of view, a funnel shows where the numbers fall, and a content map shows which page should work at each stage. The journey map explains the reasons behind the numbers. If you want the URL side of the work, read our guide to content mapping. This article stays with the buyer: what they do before they reach your site, and what they need from you at each step.
A map only matters if it changes a decision. A poster in a slide deck changes nothing. A map changes something when each weak step has a named owner and a metric to check after the fix. The rest of this guide shows how to build that kind of map.
Many maps fail before the first sticky note goes up. The team starts drawing, then discovers that three people in the room were picturing three different customers. Settle three things first.
A goal is a business outcome you can count. "Get more demo requests from agencies that already sell SEO to their clients" is a goal. "Understand our customers better" is not. The Nielsen Norman Group recommends establishing the "why" and the "what" first: the business goal, the users, the scope and who will see the result. Write the goal in one sentence at the top of the map, then check every row against it. A row that does not affect the goal is noise, and noise makes the map harder to act on.
A map follows one actor. If you mix a solo founder who pays by card with a procurement manager who needs three approvals, the middle of the map becomes an average of two people who do not exist. Build a separate map for each persona that matters to the goal. Keep the stages identical across the maps so you can compare them, and note where the buyers diverge. The differences are often the most useful part.
Pick one scenario with a clear start and end, for example "from the first search for a reporting tool to the first paid month", or "from the renewal reminder to the decision to stay". Mapping the whole company at once takes months and produces a poster nobody opens twice. A narrow scope gives you a usable map in a few weeks, and you can build the next one from what you learned.
Before you draw a single box
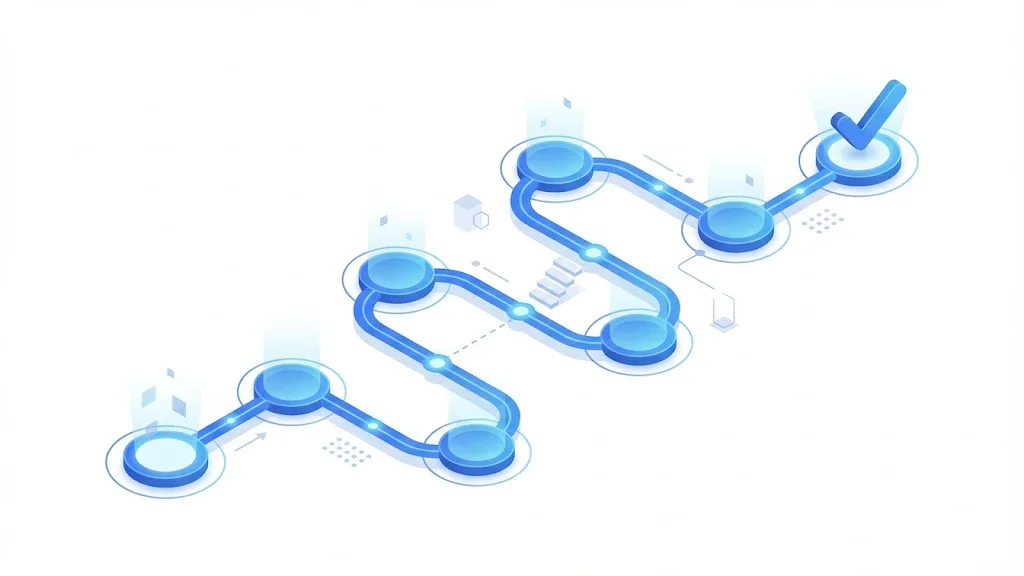
This is the practical part. The method below follows the five steps Nielsen Norman Group describes in "The 5 Steps of Successful Customer Journey Mapping" (Kate Kaplan, May 28, 2017). The steps scale. A small team can run them in a few weeks, while a company with several products may need a few months. Run them in order, because each step produces the input for the next one.
The five steps of the method
Source: Nielsen Norman Group, Kate Kaplan, May 28, 2017
Start with a conversation, not a template. For a small project, a single 30-minute meeting with the team can be enough to agree on the goal, the persona and the scope. For a B2B or enterprise effort, the same step can take weeks, because the buyer's journey crosses departments with their own targets. Invite the people who hold the data (sales, customer success, support, and whoever manages the website) and make each of them a named contributor. A map without owners is a document, not a plan.
Before you talk to a single customer, collect what your company already knows. Export the notes from recent sales calls, read the last few months of support tickets, check the questions people send through your contact forms and chat, and review which pages convert and which ones lose visitors. If time is short, the Nielsen Norman Group suggests focus groups of three to four internal employees who hold similar roles, such as two account executives and a support agent. Their disagreements are useful: each one points to an assumption you need to test.
Write each assumption as a sentence that could turn out false. "Buyers compare us with a freelancer before they consider an agency" can be tested. "Buyers care about quality" cannot. Put every assumption in its own row with three fields: what you think the buyer does, why you think so, and what evidence would prove you wrong. Those three fields become the checklist for the research in the next step.
Interview real buyers. Recruit people who recently bought from you, people who chose a competitor, and people who stopped using your product. The Nielsen Norman Group recommends 6 to 8 research participants to start external research when budget or time is limited. Ask about the last time they looked for a solution like yours: what started the search, which sources they checked, what made them trust or distrust each one, and who else took part in the decision.
Numbers from the Nielsen Norman Group method
Source: Nielsen Norman Group, Kate Kaplan, "The 5 Steps of Successful Customer Journey Mapping", May 28, 2017
The quality of the answers depends on the questions. Ask about past events, not opinions. "What did you do last Tuesday when the report failed?" gets you a behavior you can map. "Would you use a reporting tool?" gets you a polite yes that tells you nothing. Ask for the moments when the buyer stopped, hesitated or changed course, and write the answers in the buyer's own words. Those quotes later become the emotions row of your map. Ask whether they used an AI assistant during the search too, because that question is now part of the journey for many buyers.
Note
Interview people who left as well as people who stayed. A map built only from happy customers describes the journey of people who were already convinced, which is the easiest path and not the one most buyers take.
Only now draw the map. Lay the stages across the top, the rows down the side, and keep the evidence beside each cell. The Nielsen Norman Group organizes a map into three zones: the lens (persona and scenario), the phased experience, and the output (insights, opportunities and internal owners). Keep the result as a living document that the team can edit, not an emailed image. A map nobody can edit goes stale within a quarter.
The table below lists the rows of a working map. Use the same rows for every persona so the maps can be compared.
| Row | What to write | Example for a B2B software buyer |
|---|---|---|
| Actions | What the buyer does, in observable terms | Searches a category term, opens three comparison pages, books a call |
| Questions | What the buyer needs to know at that moment | Does it work with our CMS? What does it cost for 20 pages? |
| Emotions | The mood, taken from interview quotes | Worried about paying for another tool that stalls after setup |
| Touchpoints | Each place the buyer meets you or a competitor | Organic result, review site, LinkedIn post, sales email |
| Pain points | What blocks the next action | No clear answer about setup time on the pricing page |
| KPI | The number that shows whether the step works | Share of comparison-page visitors who reach the pricing page |
| Owner | The named person who can change this step | Head of content, comparison pages |
A journey map can be built from four kinds of data. Each one answers a different question, and each one can mislead you in its own way. Use at least two, and say in the map which method produced each row.
| Method | What it gives you | Where it misleads | Best for |
|---|---|---|---|
| Buyer interviews | Reasons, emotions and the words buyers use | Small samples, and people tidy up past decisions | Finding the why |
| Sales and support records | Objections, questions and failure points, already written down | Silent quitters never write in, so they are missing | Finding pain points |
| Search data (Google Search Console) | Queries, pages, clicks and impressions for each stage | Shows the path to the click, not what happens after it | Checking which stages attract search traffic |
| Questions asked to AI assistants | The shortlist questions buyers ask before they visit | Generated questions model demand, they do not count users | Mapping early research stages |
Interviews are the only method that tells you why. Their weakness is size and memory: a small sample can overrepresent your most enthusiastic customers, and people reconstruct past decisions as tidier than they were. Protect against both by recruiting a mix of buyers and by asking for the specific sequence of events, including the dead ends.
Sales notes and support tickets already contain objections, questions and failure points, written down by the people who heard them. Read the full notes, not the summary, because a phrase like "it looks complicated" tells you more than "usability concern". Tag each objection with the stage where it appeared and count the tags across a few months of records. The weakness is survivorship: people who quit silently never write to you, so they are missing from the records.
Google Search Console is Google's free tool for monitoring how your site performs in search. Its Performance report shows four metrics: clicks, impressions, click-through rate (clicks divided by impressions) and average position. You can group the table by query, page, country, device or date. For a journey map, export the queries that land on the pages of each stage, then look for queries with many impressions and a low click-through rate. Those are the searches where you appear and buyers still choose someone else, which usually points to a weak page title or search snippet.
Search data shows which stages attract traffic, but not what happens after the click. To filter the queries that signal the decision stage, paste a pattern like the one below into a query filter that accepts regular expressions, then read the results against your pricing and comparison pages.
(price|pricing|cost|how much|alternative|vs|compare)Many buyers now ask ChatGPT, Gemini, Claude or Perplexity for a shortlist before they visit any website. Those questions tend to be longer than a search query, and they name the buyer's constraints: team size, budget, platform, country. They belong in the early stages of the map. Sorank's AI Prompt Research tool, for example, generates questions a buyer in a given market might ask AI assistants and tags each one by buying intent: understanding, benefits, comparison or quality. Treat that output as a set of hypotheses to check against your search data and sales notes, not as a count of real users.
Many teams start with a stage model such as awareness, consideration, purchase, retention and advocacy. Those labels are useful for talking inside a marketing team, and our article on the marketing funnel explains the usual shorthand. They are weak for mapping, because they describe what the marketing team wants to happen, not the decision the buyer is trying to make.
Template stages versus stages from research
A good stage name describes a decision in the buyer's language. "Comparing two tools", "Justifying the budget to a manager" and "Setting up the first project" are stages. "Engagement" and "Nurturing" are not, because nobody in the buyer's head is nurturing anything. Read the names back to a customer and ask whether they recognize their own situation. If they do not, rename the stage.
Every stage should pass two tests. First, the buyer's questions should change at the boundary. Second, at least one touchpoint or question should belong to that stage alone. If two stages share the same questions, merge them. If one stage hides two decisions, such as choosing a vendor and getting internal approval, split it. Most maps have too few stages in the middle and too many at the start.
Buyers rarely move in a straight line. A prospect who loses confidence during a bad onboarding call often goes back to comparing options, and a customer who reads a review may restart the evaluation for a colleague. A straight line hides those loops. Draw an arrow from a later stage back to an earlier one, and label it with the event that caused it. Those arrows usually show the cheapest fixes on the whole map.
For each stage, list three things: the questions buyers ask in their own words, the touchpoints where they meet you or a competitor, and the page or asset that should answer the question. The questions tie the map to search intent, the reason behind a query, which our glossary entry on search intent covers in more depth. The stage also tells you which keywords to chase, and our article on buying intent keywords explains how to score them.
| Stage | Typical buyer question | Page or asset that answers it |
|---|---|---|
| Problem recognition | Why is my report always late? | Explainer article, short checklist |
| Options | Which tools solve this for a team of five? | Comparison article, category page |
| Evaluation | How hard is setup, and what breaks? | Documentation, demo video, case study |
| Decision | What does it cost, and can I cancel? | Pricing page, FAQ, trial offer |
| Onboarding | How do I get my first result? | Setup guide, first-week emails |
| Advocacy | Can I recommend this to a colleague? | Review request, referral page |
Every question in your map is a keyword, or a cluster of similar keywords. Group them into pages before you write, so that one page answers one stage and one intent. Two pages that answer the same question will compete with each other in search. Our guide to keyword clustering explains the method in detail.
Tip
Once you have the questions for each stage, run them through the free keyword clustering tool. It groups a list of keywords into pages, so you can see which questions deserve their own page and which ones belong on an existing page.
When a buyer asks an AI assistant in the options stage, the answer names some brands and skips others. Map those questions the way you map search queries: write them in full, group them by stage, and check which pages an AI answer would cite for each one, yours or someone else's. Our guide to AI visibility optimization covers what to change once you see the gaps.
A stage without a metric cannot be checked, and a metric without an owner is never acted on. For each stage, pick one number you can read in a tool you already use, then name the person responsible for it. Use one metric per stage at first. Several metrics per stage dilute attention, and you can add a second one after the first has improved.
| Stage | KPI to watch | Where to read it |
|---|---|---|
| Problem recognition | Impressions for problem queries, month on month | Search Console, Performance report |
| Options | Share of comparison-page visitors who open a product page | Web analytics, page paths |
| Evaluation | Share of trial users who open the setup guide | Web analytics, product analytics |
| Decision | Pricing-page visitors who start a sign-up | Web analytics, billing or CRM |
| Onboarding | Share of new users who get a first result in week one | Product analytics |
| Advocacy | Reviews and referrals received from customers | Review platform, CRM |
For stages that begin with a search, Search Console is the most direct source. Watch impressions for the problem queries, because they show demand that is growing or shrinking. Watch clicks and average position for the comparison queries, because they show whether you are reaching the shortlist. If a stage has no search queries at all, it is probably reached through referrals, partners or AI answers, and its KPI should come from your web analytics tool instead.
"The content team" is not an owner. "The head of content, responsible for the comparison pages" is one. The Nielsen Norman Group points out that without assigned ownership, nobody is responsible for making changes, and that gaps often appear in omnichannel journeys and in touchpoints that no internal team owns. Write the owner's name in the map next to the stage, along with the date of the next review.
List the page that answers each stage. A stage with no page is a gap, and a stage with a page that does not answer the question is a weaker gap. Rank the gaps by two things: how many buyers reach that stage, and how much a buyer lost there would cost you. Fix the top gaps first, and leave the rest in the backlog with their owners.
A map becomes useful when it produces tasks. For each weak cell, write one action, one owner, one date and one metric. Then put the action in your backlog next to the stage it serves, so the team can see which stage each piece of work improves.
One weak step, before and after the map
Score each gap on three points: how many buyers reach the stage, how strong the evidence is that the step is weak, and how much work the fix takes. A gap that many buyers reach, backed by several interviews and sales notes, and fixed with a small change should go first. A gap that few buyers reach, backed by one anecdote, and needs a rebuild can wait. The score does not need to be precise. It needs to make the order of work visible.
Each stage implies a type of content. Problem recognition needs explanations and checklists. Options needs comparisons. Evaluation needs documentation, demos and case studies. Decision needs clear pricing and answers to the objections your sales team hears most. For a worked example from a different business model, see our guide to ecommerce content strategy by buyer stage, which applies the same logic to a store.
Warning
A map with no evidence gives the team false confidence. If most cells still say "assumed", the next task is research, not new content.
Most journey maps that fail break in one of six ways. The table gives the symptom and the fix for each one. The sections after it explain how to spot each mistake in your own map and how to correct it.
| Mistake | Symptom on the map | Fix |
|---|---|---|
| Opinions only | No quotes, and most cells say "assumed" | Interview at least six buyers, then mark each cell as observed or assumed |
| One map for every persona | Contradictory pain points in one column | One map per persona, same stages, and note where they diverge |
| Drawing before synthesizing | A polished poster with no list of insights | Write five to seven insights as full sentences first |
| Stopping at the purchase | No row for onboarding, renewal or reviews | Extend the map and give each stage an owner and a metric |
| Unowned touchpoints | Partner sites and review platforms with no owner | Assign a monitor who reports once a month |
| Mapping your site, not the buyer | Every stage points to your own pages | Add the outside touchpoints, including AI answers |
This mistake is a map produced in one workshop, where the team fills every row from memory. You spot it when the emotions row has no quotes and most evidence cells say "assumed". The fix is to go back to step four, interview at least six buyers, and mark each cell as "observed" or "assumed" until the assumed cells are gone. Keep the mark visible, so readers know which parts of the map are still hypotheses.
You spot this mistake when the map has one column of "customers" and the pain points contradict each other. The buyers in the rows are different people, and a single map averages them into nobody. The fix is to split the map by persona, keep the same stages so the maps can be compared, and write down where the personas diverge. The divergences often point to different pages.
A beautiful poster with no list of insights is the usual sign. The Nielsen Norman Group warns against jumping to the visualization too early, because it produces attractive maps that are flawed. The fix is to write five to seven insights as full sentences before you design the layout. For example: "Buyers stop at the pricing page because they cannot tell whether they can cancel." An insight like that tells the team what to change, and a color scheme does not.
You spot this mistake when the map has no row for onboarding, renewal, referrals or reviews. Those stages decide how many future buyers hear about you, and they often explain why a healthy acquisition number does not produce growth. The fix is to extend the map past the purchase and give each post-purchase stage its own owner and metric. Our entry on lifecycle marketing covers how to speak to customers at each of those stages.
Rows that say "partner site", "review platform" or "marketplace listing" often have no owner, so nobody checks what buyers see there. The Nielsen Norman Group identifies these touchpoints as a common place for gaps. The fix is to assign an owner even when that owner only monitors the touchpoint and reports once a month. Someone who checks is better than a touchpoint that nobody sees.
You spot this mistake when every stage points to a page on your own site and nothing describes what the buyer read or heard before arriving. Buyers meet you in comparison articles you do not control, in AI answers, in forum threads and in a colleague's recommendation. The fix is to add those touchpoints, record what each one says about you, and decide which ones you can influence. Some you can change with a page. Others you can only monitor.
A journey map ages. Prices change, a new persona starts buying, a channel grows or dies, and the questions buyers ask AI assistants shift as those tools change. Set a review date when you publish the map. A common rhythm is a short review each quarter, checking the KPIs and the open gaps, and a full rebuild once a year or after a major change to the offer.
Use these triggers to reopen the map before the review date: a drop in conversion at one stage, a competitor that buyers keep mentioning in interviews, a change in pricing or packaging, or a new channel that brings a different kind of buyer. Each trigger should lead to a small update to the affected rows, not a full rebuild. Date each change, so the map records how the buyer's journey evolved.
When the map is stable, turn each stage into a cluster of pages that support each other and do not compete. Sorank's Topic Cluster Generator groups keywords from Search Console, tracked competitors and GEO analyses into themed clusters, and it runs an anti-cannibalization check while it builds them rather than after publication. Once the clusters exist, link them together on purpose. Our guide to internal linking strategy explains how to connect the pages of one stage to the pages of the next.
Start with the work you can do this week: write the goal, pick one persona, choose one scenario, and interview six to eight buyers. The rest of the map comes from what they tell you, and the first version will be wrong in places. That is the point of the exercise, because the wrong parts are where your next improvement is hiding.
Customer journey mapping is the process of drawing the steps a buyer takes from the first need to the purchase and after, with what they think, feel and do at each step. A good map shows where your business meets the buyer and where the experience breaks. It is built from research, not from guesses.
There is no fixed number. Use the stages your research reveals, usually three to five, and name them after the decisions your buyers make. A template with five generic stages often hides the exact step where buyers get stuck.
Combine buyer interviews, sales call notes, support tickets, your search data in Google Search Console, and the questions people ask AI assistants. Interviews explain why buyers act, the data shows how many, and AI questions show what buyers ask before they reach your site.
We analyse your competitors, your website and your AI visibility to create a tailored content plan for free.
 AI Content Brief Generator
 FAQ Schema Generator
 AI Blog Post Ideas Generator
 Structured Data Validator (Schema Validator)
 Alt Text Checker
 Internal Link Analyzer
 Backlink Challenge
 AI Meta Description Generator
 AI Blog Title Generator
 Google Indexability Checker
 AI Blog Outline Generator
 UTM Link Builder
 Keyword Clustering Tool
 Canonical Tag Checker
 XML Sitemap Generator
 Broken Link Checker
 AI SEO Title Generator
 Headline Analyzer
 SERP Preview Tool
 Redirect Checker
 Hreflang Tag Generator
 Heading Structure Analyzer
 HTTP Headers Checker
 Favicon Extractor
 SERP CTR Calculator
 SEO vs Paid Search Savings Calculator
 SEO Share of Voice Calculator
 SEO ROI Calculator
 SEO Traffic and Revenue Forecast Calculator
 SEO Budget Calculator
 SEO Break-Even Calculator
 SaaS SEO ROI Calculator
 ROAS Calculator
 Reading Time Calculator
 Ranking Gain Simulator
 Organic Traffic Value Calculator
 Organic Traffic Estimator and Website Traffic Checker
 LTV to CAC Ratio Calculator
 Local SEO ROI Calculator
 Link Building Cost Calculator
 Keyword Value Calculator
 Keyword Opportunity Score Calculator
 Keyword Density Calculator
 GEO ROI Calculator
 GEO Content Investment Calculator
 Ecommerce SEO ROI Calculator
 Customer Lifetime Value Calculator
 Customer Acquisition Cost Calculator
 CTR Calculator
 Cost Per Article Calculator
 Conversion Rate Calculator
 Content Marketing ROI Calculator
 ChatGPT Referral Traffic Estimator
 Bounce Rate Calculator
 Backlink ROI Calculator
 AI Visibility Score Calculator
 AI Traffic Value Calculator
 AI Share of Voice Calculator
 Cost of AI Invisibility Calculator
 AI Citation Rate Calculator
 llms.txt Validator
 AI Overview Checker and AI Overviews Rank Checker
 Robots.txt Checker
 AI SEO Audit
 LLM Readability Checker
 SearchGPT Readiness Checker
 Structured Data LLM Audit
 Website Crawlability AI Audit
 Why ChatGPT Is Not Recommending My Website
 Gemini Ranking Tool
 Perplexity Ranking Checker
 LLM Citation Checker
 Answer Engine Optimization Audit
 GEO Audit
 AI Search Visibility Test
 ChatGPT Visibility Checker
 llms.txt Generator
 URL Extractor
 Webpage to Markdown
 Sitemap Checker
 SERP Volatility Sensor
 Page Size Checker
 Word Counter
 Slug Generator
 Schema Generator
 Robots Generator
 OG Preview
 Meta Tags Generator
 Image Compressor
 Favicon Generator
 On-Page SEO Audit: SEO Checker and SEO Analyzer
 Backlink Analysis Tool
 Keyword Research Tool
 Domain Authority Checker
 “I tested Sorank on a real client site and it's insane. It does everything an agency would bill you $1500 a month for. It's going into production on that client now.”

 Guillaume Guersanguersanguillaume.com“We are an Ads agency and we wanted to get our SEO back on track once and for all. Sorank gave us a clear view of our site, helped us prioritize optimizations, and properly structure our content. The tool is easy to use, well designed for a team, and very practical for centralizing tracking without having to juggle multiple platforms. A very solid foundation to start fresh with our SEO.”
 Gaspard MadouiAds Agency
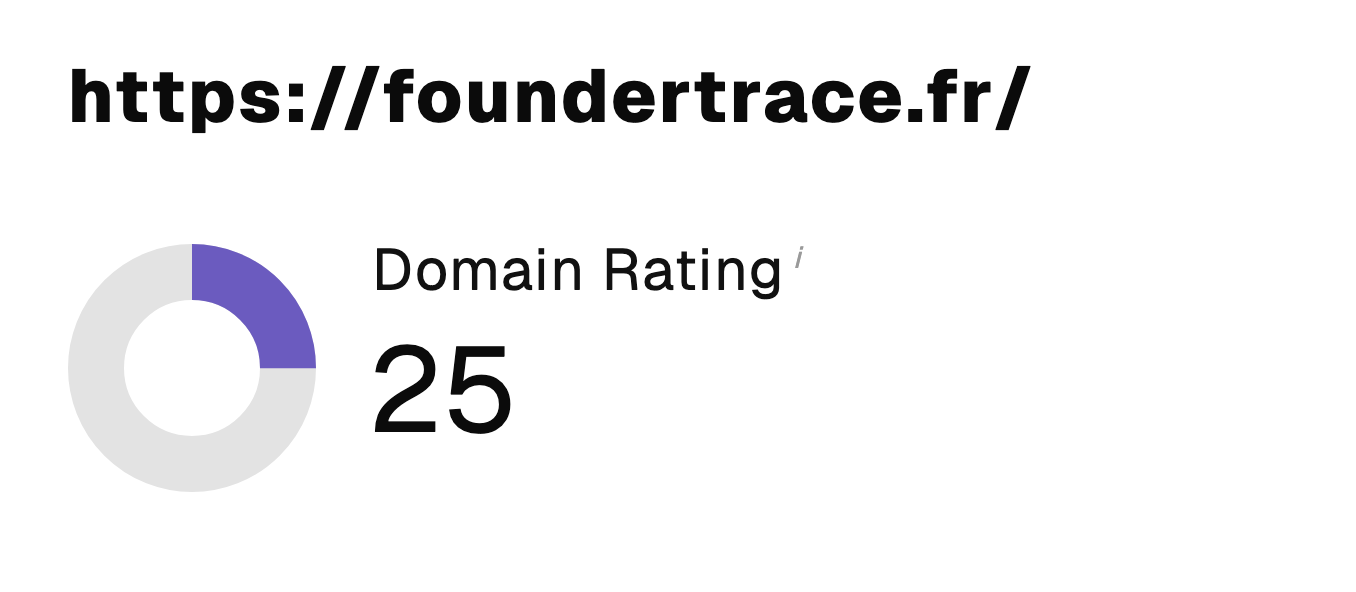 “I just let the Sorank software do its thing, and now my DR is 25 and my page is ranking higher.”
 Lucas Flandrefoundertrace.fr“I specialized in GEO thanks to Sorank. The GEO Leaderboard allows me to show my clients their position vs competitors on ChatGPT. It’s a real commercial differentiator.”
 MélanieSEO Freelance“Great service, works well for our website and helps us understand how to improve it to rank better on Google and elsewhere. Congrats, keep going, I recommend it.”
 Hugo T.E-commerce merchant