Preferences
Privacy is important to us, so you have the option of disabling certain types of storage that may not be necessary for the basic functioning of the website. Blocking categories may impact your experience on the website. More information
Privacy is important to us, so you have the option of disabling certain types of storage that may not be necessary for the basic functioning of the website. Blocking categories may impact your experience on the website. More information

Find out why your organic traffic fell: confirm the drop, split it by page and query, then test breakage, manual actions, core updates and seasonality.

Tools

In short
Start by proving the drop is real, then find where it sits: which pages, queries and devices lost clicks. Test the causes in order, from the cheapest checks to the slowest ones: measurement, technical breakage, manual actions, algorithm updates, then seasonality and competitors. Don't rewrite content until you know which cause you are dealing with.
Want to go further? Ask
Quick quiz
Is SEO right for you, and how should you start?
Sorank matches your answers


Test it for 3 days on your own site and see where you stand on Google, ChatGPT and the other AIs.
Start 3-day free trial3 days free, then stop whenever you want. 90-day results guarantee, conditions apply.
A traffic drop is a symptom, not a diagnosis. The chart tells you that visits fell. It does not tell you why. The same curve can come from a robots.txt line a developer pushed on Tuesday, a Google core update, a seasonal dip in your category, or an analytics tag that stopped firing after a redesign. Each cause needs a different response, and the wrong response can make things worse. A team that rewrites twenty pages after a seasonal dip may damage the pages that were still earning clicks.
This guide gives you the order to run the checks in, what each check looks like in Google Search Console, and the mistakes that waste weeks. It goes deep on purpose. The method only works when you run every step, including the boring ones.
Confirm the drop in four steps
The Performance report in Google Search Console gives you clicks, impressions, CTR and average position. Google Search Central's guide to debugging drops in Search traffic tells you to read the main chart first. If impressions and clicks both fell, your visibility fell. If impressions held and clicks fell, your titles and snippets lost their pull, or the results around yours became more attractive.
Average position is the metric most people stare at, and the same guide warns against focusing on it too heavily. An average is a mix of queries. A page can slip from position 3 to position 5 and lose clicks, while another page moves from 9 to 7 and gains them. Look at each query and page before you draw a conclusion from the average.
Open the Performance report and set the date range to the last 16 months, the longest window the filter offers. A drop that repeats a yearly pattern is most likely seasonal. Then use the comparison feature. Compare the last three months with the previous period to see the recent trend, or compare with the same period last year to remove the calendar. If your business has a season, such as tax software in spring or event venues in autumn, trust the year-over-year view first.
Before you blame Google, confirm that your analytics still records visits. Google's guide points you to the Data anomalies page in Search Console, where processing or logging errors on Google's side are reported. On your side, check what changed. Did someone move or remove the GA4 tag during a redesign? Did a new consent banner block the tag for most visitors? If the drop seems to sit in direct traffic, our guide to direct traffic in GA4 explains what that bucket really contains.
Note
Search Console counts clicks from Google Search. Analytics counts visits from every source, and depends on how your tracking is set up. A gap between the two is normal. A sudden change in the gap is the signal. Our piece on Google Analytics and Google Search Console covers the differences in detail.
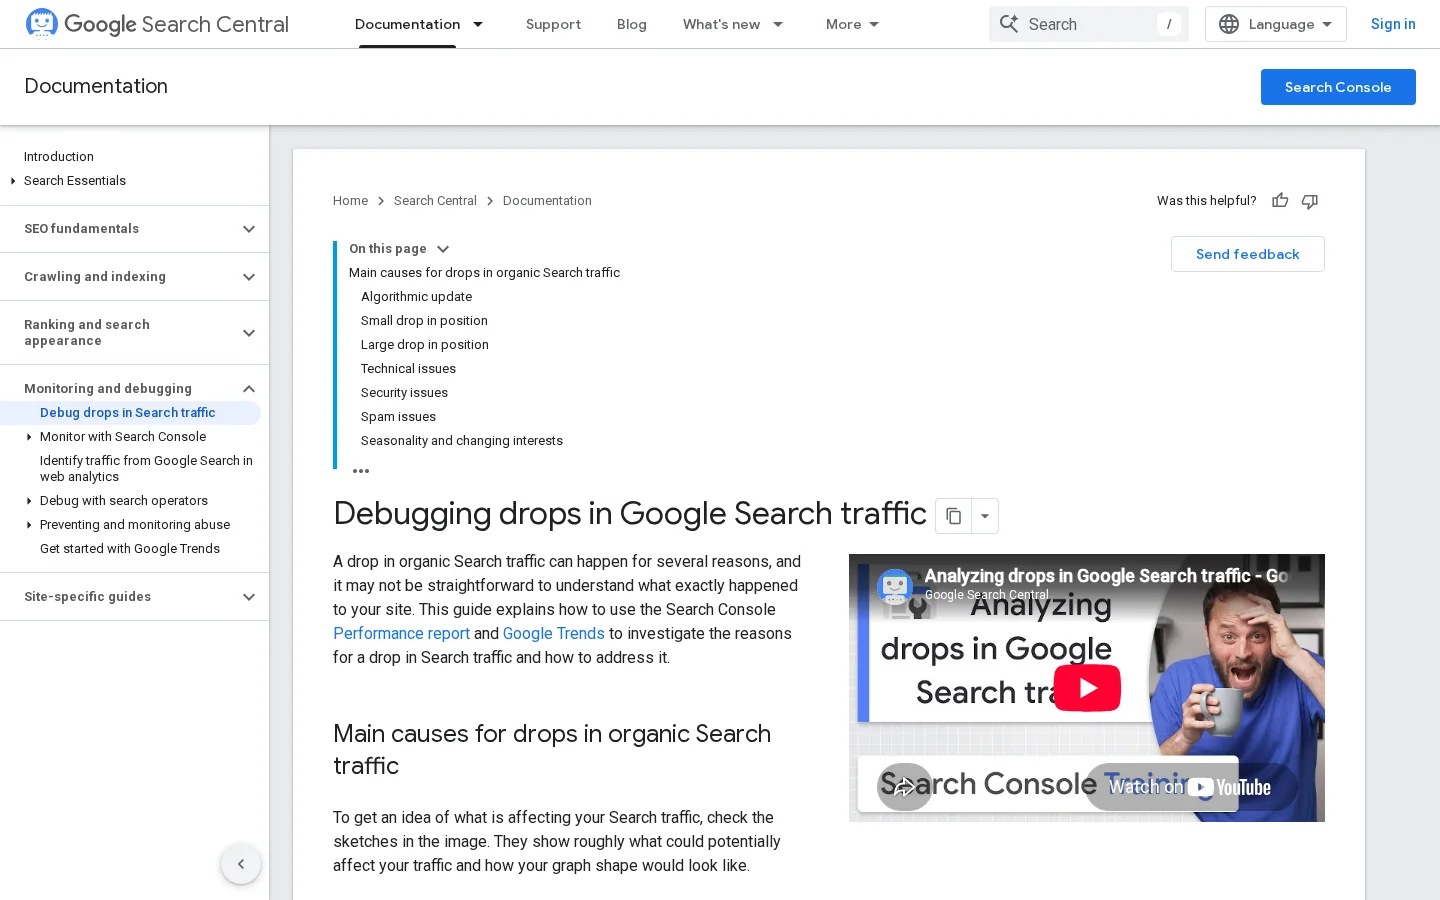
A small overall dip can hide a steep fall in one folder. Splitting the data is what turns a vague drop into a specific problem. Google's guide walks through the same segments you will check in the Performance report, and the order matters: start broad, then narrow.
A branded query contains your name, like "acme pricing". A non-branded query is what people type before they know you, like "accounting software for freelancers". If only the branded clicks fell, the cause is more likely lower brand demand or a change in how people reach you than a ranking problem. If the non-branded clicks fell, look at rankings and snippets first.
Search Console lets you filter queries with a regular expression. List your brand variants with a pipe between them, so one pattern catches them all:
acme|acme corp|acmecorpApply that pattern to the query filter to isolate branded traffic, then exclude it to keep only the non-branded queries. Keep the list up to date. A misspelling in your brand list makes the branded line look like a non-branded drop, and that sends you to the wrong fix.
Open the Pages tab and sort by the clicks difference column. This shows which URLs account for the loss, and it is the fastest way to find a pattern. Look for a whole folder, a template, a language version, or one type of page such as product or category pages. Each pattern points somewhere different. A drop across the whole site points to something global: robots rules, a deploy, a migration, or a core update. A drop in one folder points to content, internal links or a template change.
Google's guide recommends the Page indexing report when the drop is site-wide. When only a group of pages is affected, run the URL Inspection tool on a few of them. You want to see whether Google indexed the page, which canonical it chose, and when it last crawled the page. Our guide to crawl errors lists each type and its fix.
A mobile-only loss often points to a template, a script or a speed regression that affects phones. A desktop-only loss is rarer and usually points to a specific layout. A loss in images or video points to the search type, not the page. Check whether the drop sits in the Web filter, or in Google Images, Video or News. Each surface can drop for its own reasons.
| Segment | Question it answers | What a clear signal looks like |
|---|---|---|
| Date range, year over year | Is this seasonal? | The same curve shape a year earlier |
| Branded vs non-branded queries | Is it brand demand or rankings? | Only one side moved |
| Pages, sorted by clicks difference | Which URLs lost the most? | One folder, template or page type |
| Device | Is it limited to phones? | One device fell while the other held |
| Search type | Which surface lost clicks? | Web fell while images or video held, or the reverse |
| Country | Is it local or global? | One market only |

Most drops with a sharp start date come from something your team did. A developer changed a template, a plugin updated, a staging setting went live, or a migration launched without redirects. Technical breakage usually looks like a cliff on one specific day. A seasonal dip, by contrast, repeats last year's curve.
Technical checks, in order
A staging file pushed to production is the classic case. These two lines block the whole site for every crawler that respects the standard:
User-agent: *
Disallow: /
Check the file at your domain's robots.txt address after every deploy. A robots.txt checker tests the rules against the URLs you care about. The effect can lag behind the deploy, which is why people miss the link between the two. Our article on Blocked by robots.txt explains what the Search Console status means and how to fix it.
A noindex tag tells search engines to keep a page out of their index. A template, a plugin setting or an HTTP header can add it without anyone noticing. In HTML, the tag looks like this, shown in escaped form so that it displays as text:
<meta name="robots" content="noindex">Google's guide notes that a page-level problem such as a misplaced noindex produces a slower decline, so check it on the pages that lost the most clicks, not only on the homepage. In the Page indexing report, look for pages excluded by a noindex tag, and compare that list with the pages you expected to rank.
A moved URL needs a 301 redirect to its new address, and the redirect should point straight to the final page. A 302 tells search engines the move is temporary, and chains such as A to B to C slow down crawling and dilute the signals. Google's guide says that after a site move, fluctuations are normal while Google recrawls. It estimates a few weeks for medium sites and longer for large ones. If traffic does not come back on that timeline, check the redirects page by page. The rules are in our glossary entry on the 301 redirect, and a redirect checker follows any URL's chain in seconds.
Warning
Recrawl time is not a fix. If the old URLs return 404 errors, or the new ones sit at the end of a chain, waiting will not bring the traffic back. Fix the redirects first, then wait.
A manual action and an algorithmic drop can look identical in a traffic chart, but they have different causes and different ways out. A manual action is applied by a person on Google's side. An algorithmic drop comes from the ranking systems working as designed. The Manual Actions report in Search Console tells you which one you are dealing with.
Manual action or algorithmic drop?
If the Manual Actions report is empty, you have no manual action. Stop looking for one and move on. If it lists one, Google's Search Console help page on manual actions explains that a human reviewer found pages that do not comply with Google's spam policies. You must fix the issue on every affected page, then submit a review request that describes your fixes. Google says that if it determines the site is no longer in violation, it will revoke the manual action. Describe exactly what you changed and where. The reviewer will check the pages, so a vague request only adds a round trip. Our guide to Google penalties covers how to tell a manual action from an algorithmic drop in more depth.
The Security Issues report flags malware, hacked content and phishing. A compromised site can lose clicks before a visitor even reaches it, because browsers and search results show warnings. Google's guide treats security as its own branch of the diagnosis, so check it in the same pass as the manual actions.
Hacked sites often leave a trail in the index. Search your domain with the site: operator plus words you never published, such as pharmaceutical or gambling terms, and look for URLs you don't recognize. New unknown URLs are a red flag that the cause is a compromise, not a ranking change. Clean the injected pages, remove the malicious files, and then request a review if a manual action was also applied.
Google Search Central's documentation on core updates describes them as significant, broad changes to its search systems, announced on the Search Status Dashboard. Google says they "don't target specific sites or individual web pages." A page that moves down is not automatically a bad page. The update changes how the systems weigh relevance and quality across the web, so a site can lose positions on the queries where others now deserve to rank higher. Our guide to the Google algorithm explains the ranking systems behind those changes, and the March core update shows how one rollout was measured.
Check the Search Status Dashboard for the start and the end of the rollout. Google's guidance is to confirm the update has finished, then wait at least a week before comparing your traffic with the week before the update began. Reading the data mid-rollout is a common way to misread a fake drop, and it is the fastest route to an action you did not need.
Google's guidance changes with the size of the drop. For a small drop, Google advises against drastic action, and it recommends avoiding changes to content that already performs well. For a large, sustained drop, review the whole site against Google's self-assessment questions, then evaluate the most affected pages. Google also warns against quick fixes, and it treats deleting content as a last resort. Removing unhelpful content can help the good content on the site perform better. Deleting pages that still earn clicks is a mistake that is hard to undo.
Recovery takes time. Google says that if you have made improvements, it may take time to see an effect in results, and that some changes show within days while confirmation can take months. Plan your review in weeks, not days.
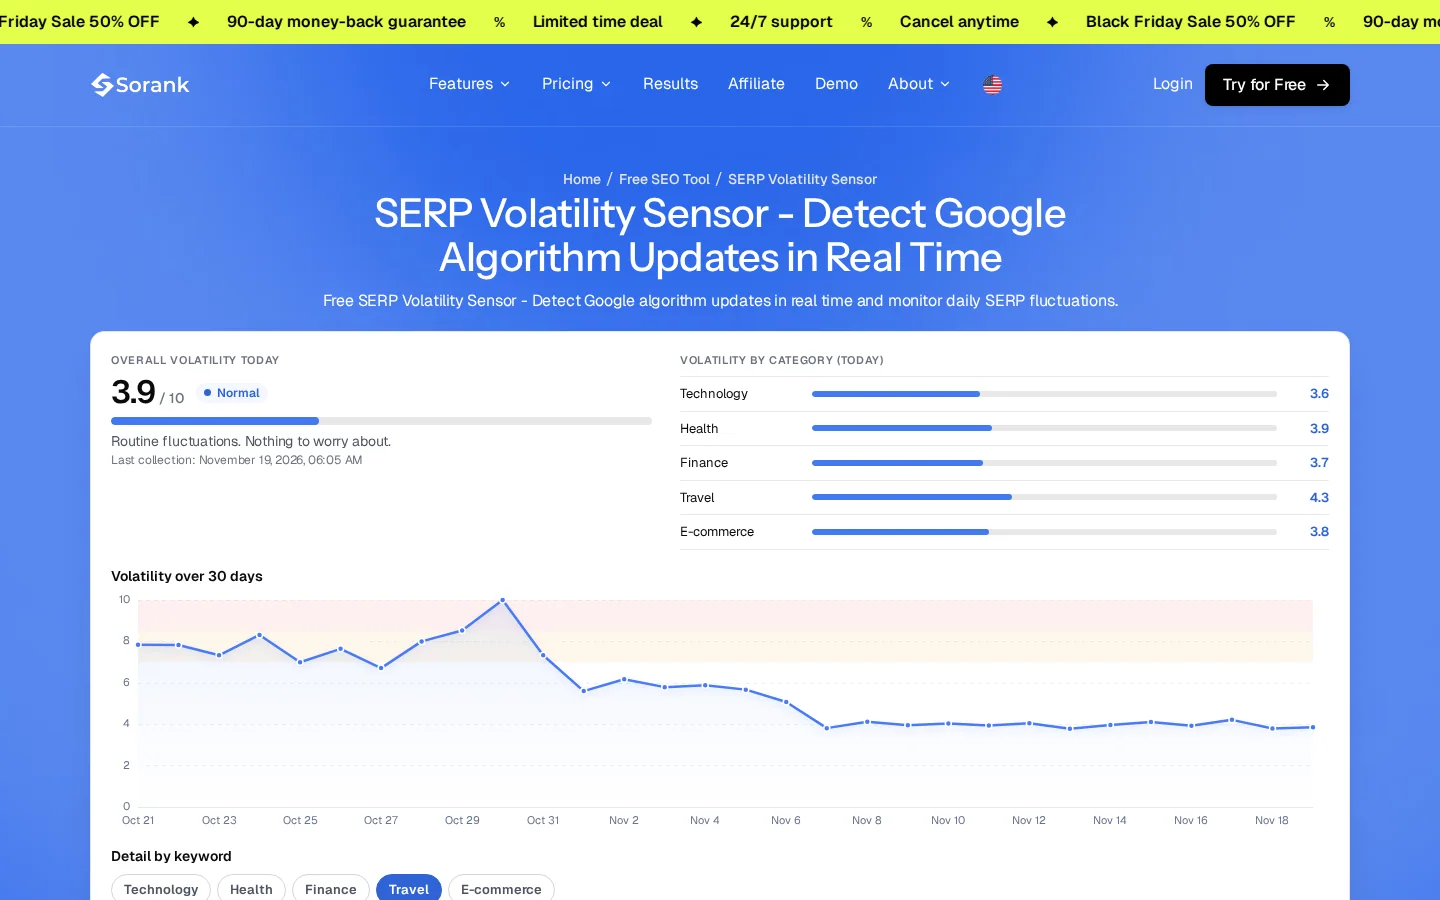
The quickest way to tell an update from a problem on your own site is to check the wider market. A volatility signal measures how much the results move from one day to the next, across many queries at once.
Tip
Sorank's free SERP volatility sensor scores the daily change in Google's top 10 for 20 benchmark keywords, on a scale from 0 to 10. Below 5, results move as usual. From 7, a broad change such as an algorithm update is likely. The benchmarks are English keywords searched in the United States, so read the score as a market signal, not a verdict on your niche. If your drop lines up with a high score, the cause is probably market-wide. If the score stays low while your traffic falls, start with your own site.
Many drops that are neither technical nor manual come from the market, not from you. Demand moves with the calendar, competitors publish better pages, and older content slowly loses relevance. These causes are the hardest to see, because the chart looks like a loss of rankings while the cause sits outside your site. The table below helps you separate them.
| Cause | Signal | How to confirm it |
|---|---|---|
| Seasonality | The curve repeats last year's shape | Year-over-year comparison in the Performance report, and Google Trends on your core terms |
| Demand shift | Impressions fall on the same queries | Google Trends for the head terms, and a branded vs non-branded split |
| Competitor gains | Impressions hold, clicks fall, and rivals rank above you | A manual search of your top queries, noting who ranks above you and what changed |
| Content decay | A slow slide on specific pages over many months | Clicks by page across the 16-month view |
Compare the same weeks last year. If the curve repeats, nothing broke. Check Google Trends to see whether interest in your terms fell across the market or only on your site. A category can dip after a holiday, a budget cycle, or a launch that moved demand somewhere else. Don't overhaul the site in response to a seasonal dip. The traffic usually returns when the season does, and an overhaul can damage the pages that carry you through the slow months.
Your position can hold while a rival's rises, and the result is the same: fewer clicks. Google's guide notes that a competitor's improvement can cause your loss, and that rivals may have stronger rich results. Search your top ten queries, and write down who now ranks above you and what they changed: a more direct answer, a clearer title, structured data, or a newer guide. Then decide whether you can make your page the better answer for that query. If you can't, put the effort into the queries where you already have a credible case.
Content decay is a gradual fall on individual pages. A page that held its positions for two years loses clicks when its information goes stale, when newer pages answer the question better, or when the way people search for the topic shifts. It rarely shows as a cliff. It hits pages one at a time, so a site-wide view can hide it.
The test is simple. If the decline on a page started months ago and tracks a loss of freshness, treat it as decay. If it started on one day across many pages, look for a deploy or an update instead. Our glossary entry on content decay covers the recovery side in depth, and it is the next read if this is your case.
The seven-step diagnosis
Write one sentence that names the cause, the evidence and the test. For example: "Clicks fell in the blog folder on the day the template changed, and only on mobile." A sentence like that tells you what to fix and what would prove you wrong. Vague notes such as "Google changed something" lead to random edits, and random edits make the next diagnosis harder.
Example
Imagine clicks fall on the guides in one blog folder, and the desktop line holds. Someone blames the last core update. The Pages table shows the loss sits in that folder only, and a template change shipped the same week. The hypothesis to test is the template, not the update. Restore the previous template on one guide, leave everything else alone, and measure that page for several weeks before you change the rest.
Fix one cause, then wait. Search Console data lags, and some changes take time to show up. Google says some changes show within days, while confirmation can take months. A dashboard that puts Google clicks and AI visits side by side helps you see whether the pages you fixed actually moved.
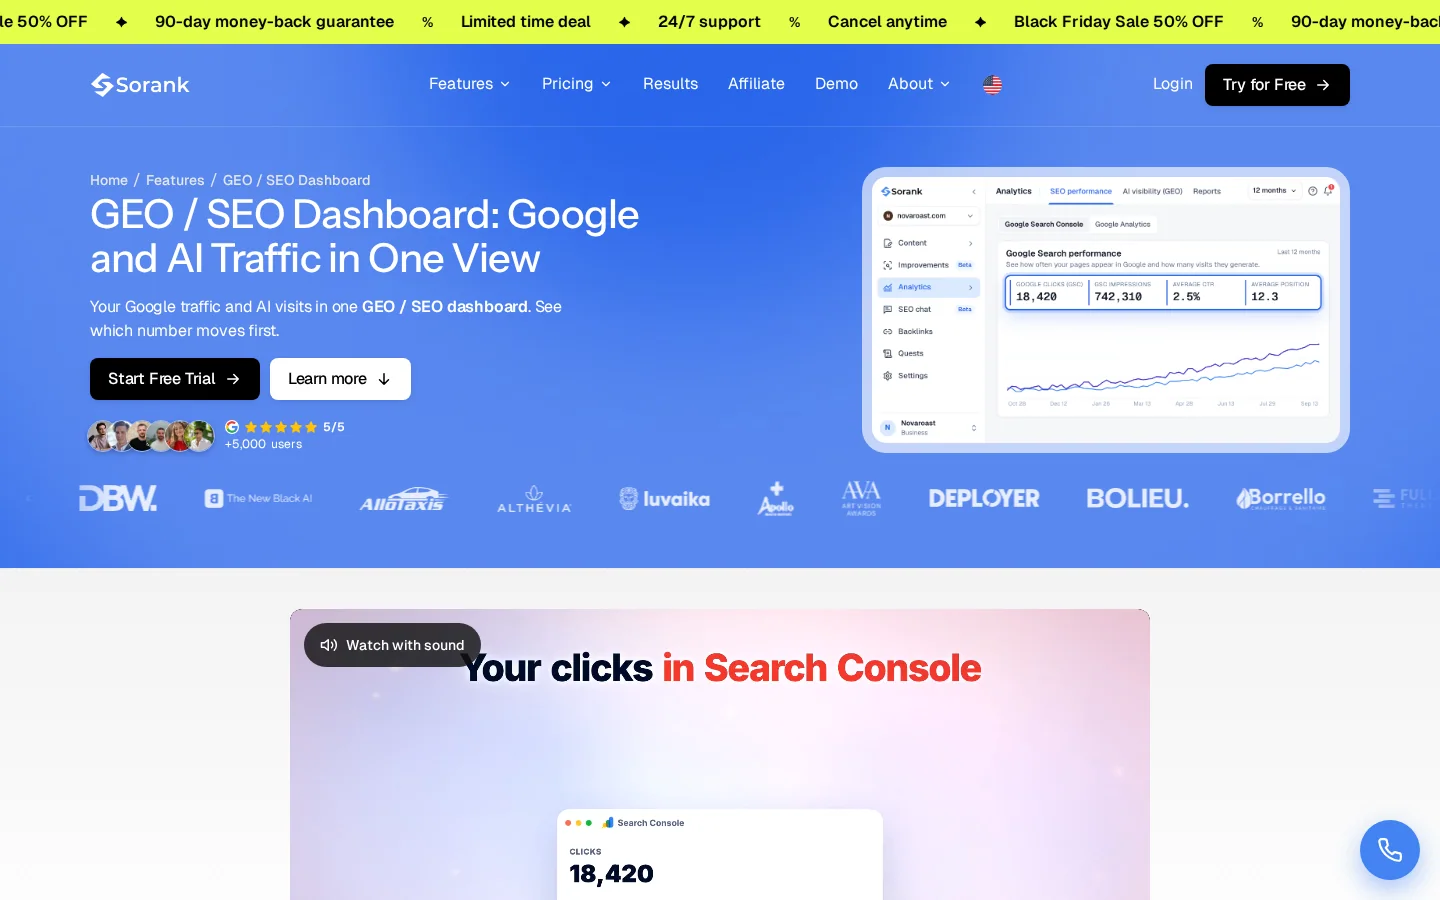
The GEO / SEO dashboard from Sorank shows Search Console clicks, impressions, CTR and average position next to visits from ChatGPT, Claude, Gemini, Perplexity and Grok. Pages sort into Popular, Growing, Declining and Lost, so a declining page shows up before it disappears. In Google Analytics, a visit from ChatGPT is mixed in with every other source, which is why AI traffic so often goes unnoticed during a drop analysis. If your AI referrals are the part that moved, our piece on AI search volatility explains why answers keep changing.
Habits that waste weeks, and the ones that find the cause
Sometimes every check comes back clean. The tracking is fine, there is no manual action, the robots and noindex rules are correct, and the pages that lost clicks are not seasonal. In that case the cause is usually a mix: several small changes, a competitor with a better page, and a slow decay across the same set of URLs. Don't stop at "unknown". Use the table below to choose what to do next.
| Still unexplained | What to do next |
|---|---|
| The drop is steady over many months | Audit content decay on the top pages, then compare them with the pages that now rank above you |
| The drop started on one day, but no deploy is linked to it | Ask the developers and the content team for a change log for that date, including third-party scripts and plugins |
| Only AI referral traffic moved | Check how AI assistants cite your pages, and track which pages they send visits to |
| Impressions and clicks both fell across several query groups | Run a full SEO audit against Google's self-assessment questions, then fix the most affected pages first |
Keep the record. A dated log of changes, drops and fixes is what turns the next drop from a panic into a short investigation. Start the log this week, before you need it. Our guide to a content audit shows how to turn the same pages into a plan you can review every quarter.
A sudden drop often comes from one of three places: a change on your own site, a manual action, or a Google update. Check the Performance report by page and query first, then look for a deploy or any change dated to the same day. A broad core update becomes the likely cause only after the technical checks come back clean.
It depends on the cause. Fixing a robots.txt rule or a noindex tag can bring pages back within weeks, while recovering from a core update can take months. Google says some changes show within days, but confirmation can take months.
Open the Manual Actions report in Search Console. If it lists a manual action, a Google reviewer found pages that break the spam policies. If the report is empty, you have no manual action, and the drop is more likely technical, algorithmic or seasonal.
We analyse your competitors, your website and your AI visibility to create a tailored content plan for free.
 AI Content Brief Generator
 FAQ Schema Generator
 AI Blog Post Ideas Generator
 Structured Data Validator (Schema Validator)
 Alt Text Checker
 Internal Link Analyzer
 Backlink Challenge
 AI Meta Description Generator
 AI Blog Title Generator
 Google Indexability Checker
 AI Blog Outline Generator
 UTM Link Builder
 Keyword Clustering Tool
 Canonical Tag Checker
 XML Sitemap Generator
 Broken Link Checker
 AI SEO Title Generator
 Headline Analyzer
 SERP Preview Tool
 Redirect Checker
 Hreflang Tag Generator
 Heading Structure Analyzer
 HTTP Headers Checker
 Favicon Extractor
 SERP CTR Calculator
 SEO vs Paid Search Savings Calculator
 SEO Share of Voice Calculator
 SEO ROI Calculator
 SEO Traffic and Revenue Forecast Calculator
 SEO Budget Calculator
 SEO Break-Even Calculator
 SaaS SEO ROI Calculator
 ROAS Calculator
 Reading Time Calculator
 Ranking Gain Simulator
 Organic Traffic Value Calculator
 Organic Traffic Estimator and Website Traffic Checker
 LTV to CAC Ratio Calculator
 Local SEO ROI Calculator
 Link Building Cost Calculator
 Keyword Value Calculator
 Keyword Opportunity Score Calculator
 Keyword Density Calculator
 GEO ROI Calculator
 GEO Content Investment Calculator
 Ecommerce SEO ROI Calculator
 Customer Lifetime Value Calculator
 Customer Acquisition Cost Calculator
 CTR Calculator
 Cost Per Article Calculator
 Conversion Rate Calculator
 Content Marketing ROI Calculator
 ChatGPT Referral Traffic Estimator
 Bounce Rate Calculator
 Backlink ROI Calculator
 AI Visibility Score Calculator
 AI Traffic Value Calculator
 AI Share of Voice Calculator
 Cost of AI Invisibility Calculator
 AI Citation Rate Calculator
 llms.txt Validator
 AI Overview Checker and AI Overviews Rank Checker
 Robots.txt Checker
 AI SEO Audit
 LLM Readability Checker
 SearchGPT Readiness Checker
 Structured Data LLM Audit
 Website Crawlability AI Audit
 Why ChatGPT Is Not Recommending My Website
 Gemini Ranking Tool
 Perplexity Ranking Checker
 LLM Citation Checker
 Answer Engine Optimization Audit
 GEO Audit
 AI Search Visibility Test
 ChatGPT Visibility Checker
 llms.txt Generator
 URL Extractor
 Webpage to Markdown
 Sitemap Checker
 SERP Volatility Sensor
 Page Size Checker
 Word Counter
 Slug Generator
 Schema Generator
 Robots Generator
 OG Preview
 Meta Tags Generator
 Image Compressor
 Favicon Generator
 On-Page SEO Audit: SEO Checker and SEO Analyzer
 Backlink Analysis Tool
 Keyword Research Tool
 Domain Authority Checker
 “I tested Sorank on a real client site and it's insane. It does everything an agency would bill you $1500 a month for. It's going into production on that client now.”

 Guillaume Guersanguersanguillaume.com“We are an Ads agency and we wanted to get our SEO back on track once and for all. Sorank gave us a clear view of our site, helped us prioritize optimizations, and properly structure our content. The tool is easy to use, well designed for a team, and very practical for centralizing tracking without having to juggle multiple platforms. A very solid foundation to start fresh with our SEO.”
 Gaspard MadouiAds Agency
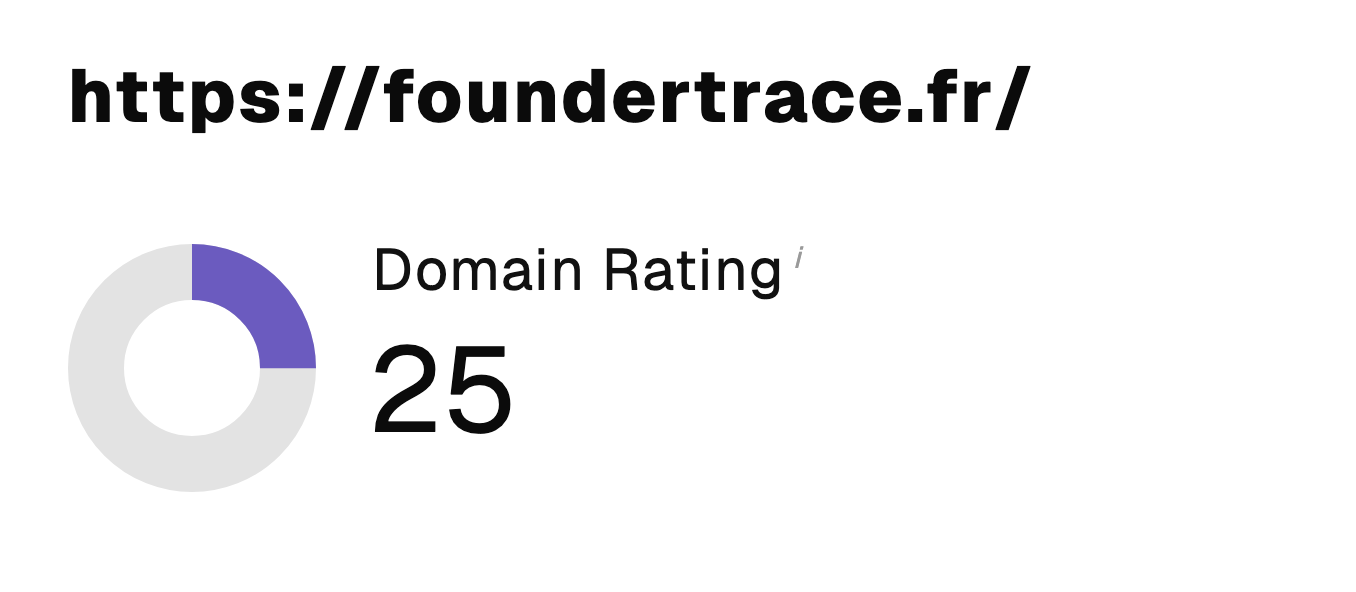 “I just let the Sorank software do its thing, and now my DR is 25 and my page is ranking higher.”
 Lucas Flandrefoundertrace.fr“I specialized in GEO thanks to Sorank. The GEO Leaderboard allows me to show my clients their position vs competitors on ChatGPT. It’s a real commercial differentiator.”
 MélanieSEO Freelance“Great service, works well for our website and helps us understand how to improve it to rank better on Google and elsewhere. Congrats, keep going, I recommend it.”
 Hugo T.E-commerce merchant