Preferences
Privacy is important to us, so you have the option of disabling certain types of storage that may not be necessary for the basic functioning of the website. Blocking categories may impact your experience on the website. More information
Privacy is important to us, so you have the option of disabling certain types of storage that may not be necessary for the basic functioning of the website. Blocking categories may impact your experience on the website. More information

Which SaaS statistics matter for acquisition, churn and search, how to trace each one to its primary source, and the mistakes to avoid when quoting them.

In short
SaaS statistics are measured figures about software companies, such as trial conversion, churn, customer acquisition cost and how much traffic comes from search and AI answers. Quote a figure only when you can name its primary source, its date, its definition and its method.
Want to go further? Ask
Quick quiz
Which content should you focus on first?
Sorank matches your answers


Test it for 3 days on your own site and see where you stand on Google, ChatGPT and the other AIs.
Start 3-day free trial3 days free, then stop whenever you want. 90-day results guarantee, conditions apply.
Track the figures that change what you do next week: where your sign-ups come from, how many trials become paying customers, what each customer costs to win and how long they stay. Market size and funding totals are useful context, but they rarely justify a budget change on their own. Our SEO statistics roundup covers search at large, and our B2B marketing statistics page covers buyer behavior. This page stays on the numbers a SaaS team uses to decide.
Five SaaS numbers to keep in a shared sheet
Start with organic sessions and sign-ups by page type. A SaaS site usually has at least three kinds of page: product pages, comparison pages and guides. Their traffic and conversion rates differ a lot, so one blended average hides the signal. Split organic traffic by page type, then by query group, so you can see which keywords bring trials and which only bring readers.
Next, look at search demand for your category. Keyword volume tells you how many people type a query each month. It does not tell you whether those people want to buy. Pair volume with intent. A query like "best CRM for small agencies" is close to a purchase, while "what is a CRM" comes much earlier in the research.
For a subscription business, three numbers matter most: trial-to-paid conversion, monthly churn and CAC by channel. Compare them by channel, not only overall. Say organic search brings customers at a lower CAC than paid ads but needs several months to ramp up. That tradeoff belongs in your plan, and a single company-wide average would hide it completely.
Tip
Before you set a target for organic revenue, run your own traffic and conversion numbers through the SaaS SEO ROI Calculator. It shows the recurring revenue your organic traffic could project, which makes the trade-off with paid channels easier to discuss.
A figure is safe to quote when you can reach the document that first published it, read its method and confirm that it measures what your sentence says. Most wrong SaaS numbers are not invented on purpose. They get copied from a roundup that copied another roundup, and the original context is lost on the way.
Open the roundup, find the figure, and follow its link until you reach a document with an author, a date and a method. If the chain ends in "industry experts" or in another roundup, the figure is not verified. A clear example is a 702% three-year SEO ROI figure for B2B SaaS. In our search for this article, it appeared in several 2026 roundups, but we could not trace it to a primary study. Treat it as a claim, not as a fact, until you find the original.
Two studies can both report "CTR" and mean different things. One may count only the top organic result, another every result on the page, and a third may use impressions from a different date window. Before you use a figure, write its definition in one sentence. If you cannot write that sentence, you do not understand the number well enough to quote it.
Many SaaS statistics compare two groups. A study might find that companies with a blog report more trials, but the blog may not be the cause. Larger companies publish more content and also have bigger marketing budgets, so both effects can come from company size. Write what the data shows, such as "companies that published weekly had more trials", not "weekly publishing causes more trials", unless the study tested that cause directly.
Primary source vs roundup article

To measure search demand for a SaaS product, group queries by intent first and by volume second. Informational queries bring early readers, comparison queries bring buyers who already have a shortlist, and branded queries show how well people already know you. Each group needs a different page and a different target number, so a single traffic goal for the whole site is almost always the wrong target.
Take your top 100 queries and label each one with a stage: learn, compare, choose or brand. Then check which page ranks for it. A "learn" query that ranks your pricing page is a mismatch, and a "choose" query that ranks a long blog post often loses the sale because the reader has to dig for the offer. Mapping is the step most teams skip, and it explains a large part of the gap between traffic and revenue.
Map a SaaS keyword to a funnel stage
Volume is an estimate from keyword tools. It is rounded, it lags real search behavior, and it can differ by several times between tools. A query with a few hundred monthly searches can still bring more qualified trials than a query with ten times the volume, if the buyer intent is stronger. Use volume to order your list, then check the real clicks in Search Console after you publish. For the method behind keyword research, read the keyword research glossary entry, and for automation, see automated keyword research for Google and AI.
For the wider ranking picture of software products, read our SaaS SEO guide. It covers how the stages connect to pages, not just to keywords.
When an AI Overview appears on an informational query, the top organic result gets a lower average click-through rate. In a study published on April 17, 2025, Ryan Law and Xibeijia Guan at Ahrefs found a 34.5% lower average CTR for the top-ranking page on keywords with an AI Overview, in their Ahrefs analysis of 300000 keywords. The result is a correlation, so treat it as a planning input, not as a fixed loss that applies to your site.
The AI Overview gap in one study
Source: Ahrefs, Ryan Law and Xibeijia Guan, April 17, 2025
The sample had 150000 informational keywords with an AI Overview and 150000 similar informational keywords without one. Because both groups are informational, the gap is not simply a difference in query type. It still does not prove that an AI Overview removed every click it appears to remove. The study cannot tell you which users would have clicked anyway, or whether some of them clicked later from a different query. Keep that limit in the sentence whenever you quote the figure.
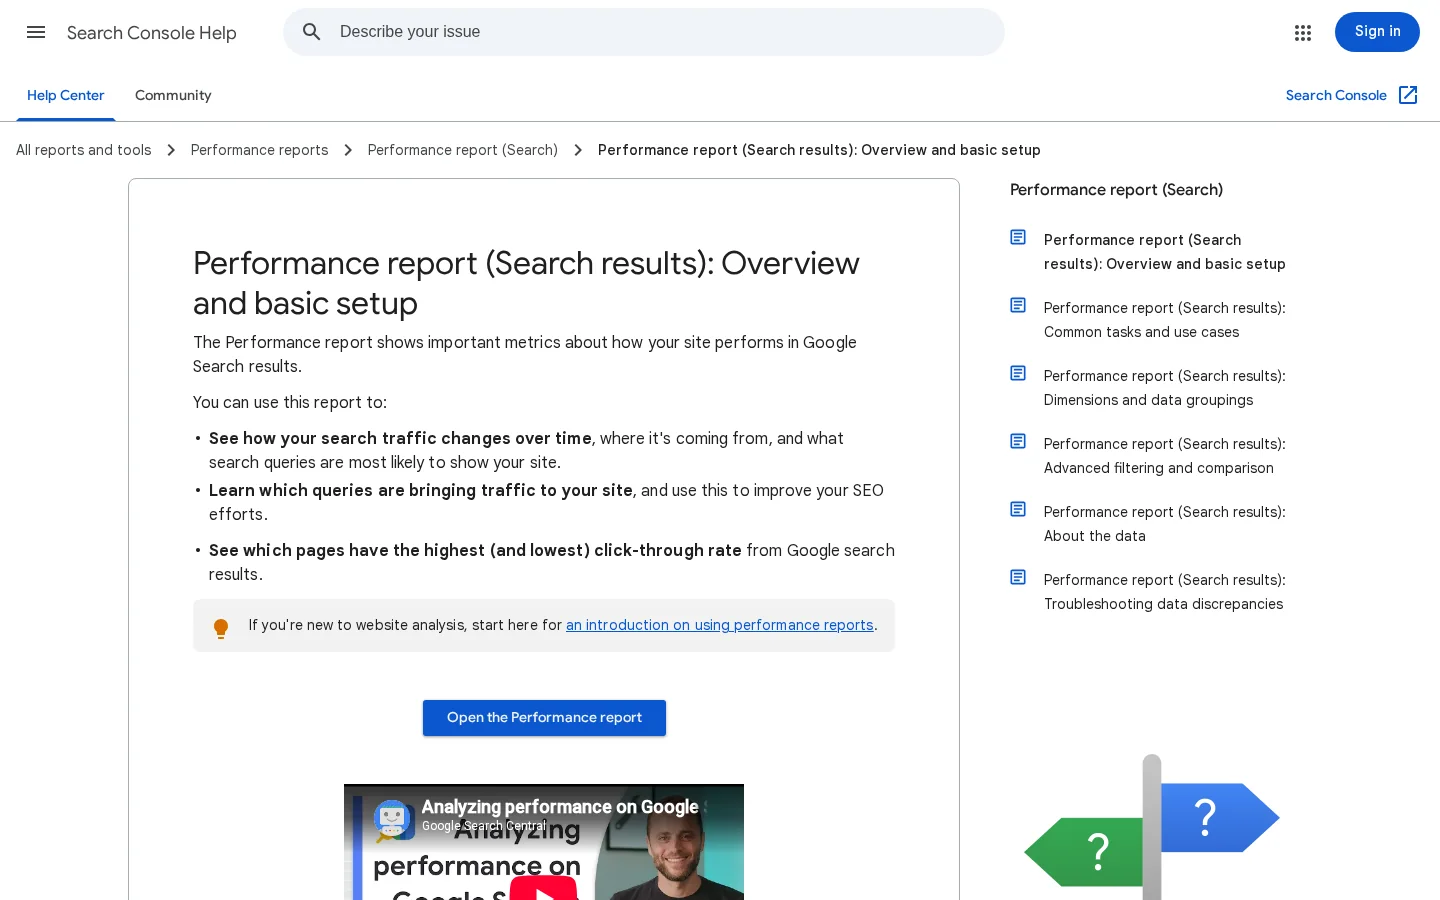
In Google's Search Console help for the Performance report, CTR is defined as the click count divided by the impression count. Clicks are the number of times a user clicked your site from Google Search results, and impressions count how many times your site appeared in Search results. Average position is the average position of the topmost result from your site, and its scope changes between the chart and the table views. So compare CTR for the same query group over the same date range, not for your whole site across a year.
Inside the Performance report, add the position filter to the query view. Then compare pages that rank in the same band, such as positions 1 to 3 against positions 1 to 3. A page at position 8 will always show a lower CTR than a page at position 2, so a raw site-wide average tells you almost nothing about how well your title and snippet perform. Export the rows to a sheet, add a column for CTR, and sort by impressions. The pages with high impressions and low CTR are the ones where a better title or description can change the result this month.
CTR = clicks / impressions x 100
Example: 120 clicks / 4000 impressions x 100 = 3%
Tip
Put your own export into the CTR Calculator to check your numbers against the formula above before you compare them with any published benchmark.
Use the ratio to build a more cautious forecast for informational pages. Index the top result without an AI Overview at 100. With an AI Overview, the study's average sits at 65.5, which is the 34.5% lower CTR expressed as an index. Apply that index only to the informational queries in your forecast, and keep commercial queries on their own line, because the study does not cover them.
Add SoftwareApplication JSON-LD to your product page with a name and either an aggregateRating or a review, then check it in the Rich Results Test. Google's SoftwareApplication documentation lists name as required and says you must include one of aggregateRating or review. It also recommends applicationCategory and operatingSystem, and it lists offers among the supported properties. Google does not guarantee that a rich result will appear, even when the markup is valid.
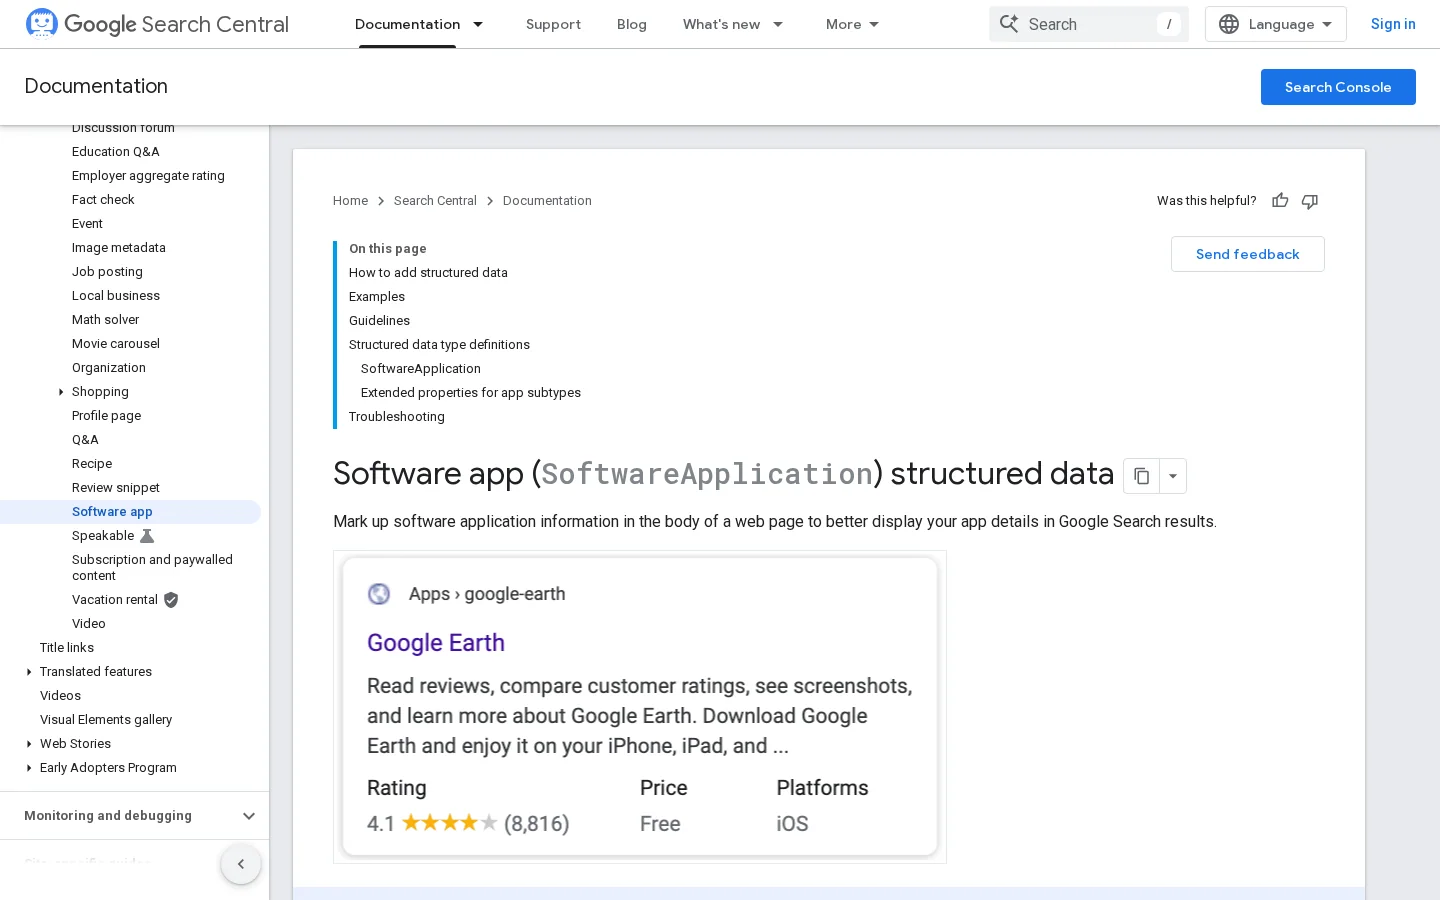
Set applicationCategory to a value from Google's list of supported app types, not to a label you made up. Add operatingSystem only when the value describes your product accurately. For pricing, set offers.price to 0 for a free plan. For a paid plan, include offers.priceCurrency as well, because otherwise Google tries to work out the currency itself.
Put SoftwareApplication markup on the page that describes the product itself, such as the main product or pricing page. Do not copy it onto every blog post that mentions your tool. A guide about a category is not the app, and markup that describes the wrong thing creates a mismatch between the page and its data. Keep one product page per product, and make sure the name in the markup matches the name in the page title and the logo text.
The example below describes a SaaS tool with a free plan and a rating. Replace the name and the rating with your own figures. The rating must match reviews that visitors can see on the page, and a mismatch can block eligibility even when the syntax passes. The BusinessApplication value is a schema.org category for business software, so check it against Google's current list before you publish.
{
  "@context": "https://schema.org",
  "@type": "SoftwareApplication",
  "name": "Your SaaS name",
  "applicationCategory": "BusinessApplication",
  "aggregateRating": {
    "@type": "AggregateRating",
    "ratingValue": 4.6,
    "ratingCount": 120
  },
  "offers": {
    "@type": "Offer",
    "price": 0,
    "priceCurrency": "USD"
  }
}
Ship and validate the markup
For the technical side around this markup, such as crawl access and page templates, read technical SEO for SaaS.
You can get a SaaS figure from public company filings, third-party research, your own product data or an original survey. Use your own data for operational decisions, third-party research for market context, and filings for company-level facts. Each method answers a different question, so the right choice depends on what you need to prove and who will read it.
The principle is simple: a listed company must publish audited financial figures. Use filings for revenue, customer counts or retention that a public SaaS company reports. The advantage is that the figure is verified and dated. The limit is that most SaaS firms are private, and reported metrics such as annual recurring revenue often use the company's own definition. Before you quote one, check whether it means the same thing as your sentence.
Research firms survey a market or model it. Use their reports for market size and category trends. The advantage is broad coverage, often with a stated method. The limit is that many full reports are paywalled, so you see a summary that may drop the caveats. Forecasts also get revised. Note the release date of any forecast you quote, and check whether a newer edition exists before you use it in a plan.
You count events in your product, billing system or analytics tool. Use this for any decision about your own funnel, pricing or retention. The advantage is that the number is exact, current and under your control. The limit is definitions: trial starts, activated users and paying customers can be counted three different ways, and the totals will not match. Write the definitions down before you report a number, and keep them the same from one month to the next.
You ask customers or prospects a set of questions. Use a survey for questions no public data answers, such as why users cancelled. The advantage is a figure that nobody else has, and other sites will cite it. The limit is sample bias: people who answer a survey are often the happiest or the most annoyed. Publish the sample size, the dates and the exact question wording, or the figure will not be trusted.
| Source | Best for | Main limit | Effort |
|---|---|---|---|
| Public filings | Company-level revenue and customer facts | Few SaaS companies are public | Low |
| Third-party research | Market size and category trends | Paywalls and revised forecasts | Low to medium |
| Your own product data | Your funnel, pricing and retention | Definitions that drift over time | Medium |
| Original survey | Questions no public data answers | Sample bias | High |
A good SaaS statistics page is a table with one row per figure: the number, its definition, its primary source, the publication date and the date you last checked it. Readers can verify any line in a minute, and you can remove a line when its source is withdrawn or replaced. Pages written as long prose go stale quickly because nobody knows which sentence to update.
Maintain a statistics page in five steps
A chief executive wants market size, growth and unit economics. A marketing lead wants channel conversion and CAC. An SEO specialist wants search demand, CTR and indexing health. Give each reader a short section with their own figures rather than one long list, because a long list hides the three numbers each person actually needs.
Sorank covers the search rows of this table. Its GEO / SEO dashboard puts Google and AI traffic in one view, so the search figures from the sections above sit next to each other. For keyword groups and their intent, the automated keyword research page shows what the tool does. Use these sources for the search rows and your own product data for the rest.
The most common mistakes are quoting a roundup as a source, mixing definitions, presenting an old year as current and turning a correlation into a cause. Each one is easy to spot once you know what to check for, and each one has a simple fix.
What it is: the figure comes from a blog post that cites no original document. How to spot it: the post has no link to a primary source, or the link leads to another post. How to fix it: follow the chain to the first publisher, or drop the figure and use one you can verify.
What it is: two figures that look alike measure different things, such as "customers" counted at trial start versus paid conversion. How to spot it: the number moves a lot between two sources that seem to measure the same thing. How to fix it: write the definition next to the number, and convert or drop the figure if the definitions do not match.
What it is: a figure from an earlier year presented as the state of the market today. How to spot it: no date, or a date far from the sentence that uses it. How to fix it: put the year in the sentence, such as "in 2025, according to", and check whether a newer release exists. Forecasts are the worst case, because the date of the forecast matters as much as the number.
What it is: "publishing this format doubles trials" when the study only found that the two move together. How to spot it: the study observed companies rather than testing a change, and the authors use words like "associated with" or "correlated with". How to fix it: rewrite the claim as an association and keep the caveat in the same sentence.
Quoting a SaaS statistic: before and after
Pick the five figures your team uses in real decisions, trace each one to its primary source, and write its definition beside it. Replace any figure you cannot verify with your own product data, which is the strongest source for your own decisions. You can build a usable statistics page in an afternoon, and every line on it can be checked by the reader.
Before you publish a SaaS statistic
Start with public company filings, original research reports and your own product data. Check each figure for a named author, a publication date and a method, and if a number appears only in roundup articles, trace it to the first publisher before you use it.
Ahrefs found a 34.5% lower average CTR for the top organic result on informational keywords with an AI Overview, in a study of 300000 keywords published on April 17, 2025. The study covers informational queries, not SaaS keywords specifically, so measure your own CTR in Search Console before you change your forecast.
No. Google does not guarantee that structured data features will appear in search results. The markup needs a name and an aggregateRating or review, and it must match what visitors can see on the page.
We analyse your competitors, your website and your AI visibility to create a tailored content plan for free.
 AI Content Brief Generator
 FAQ Schema Generator
 AI Blog Post Ideas Generator
 Structured Data Validator (Schema Validator)
 Alt Text Checker
 Internal Link Analyzer
 Backlink Challenge
 AI Meta Description Generator
 AI Blog Title Generator
 Google Indexability Checker
 AI Blog Outline Generator
 UTM Link Builder
 Keyword Clustering Tool
 Canonical Tag Checker
 XML Sitemap Generator
 Broken Link Checker
 AI SEO Title Generator
 Headline Analyzer
 SERP Preview Tool
 Redirect Checker
 Hreflang Tag Generator
 Heading Structure Analyzer
 HTTP Headers Checker
 Favicon Extractor
 SERP CTR Calculator
 SEO vs Paid Search Savings Calculator
 SEO Share of Voice Calculator
 SEO ROI Calculator
 SEO Traffic and Revenue Forecast Calculator
 SEO Budget Calculator
 SEO Break-Even Calculator
 SaaS SEO ROI Calculator
 ROAS Calculator
 Reading Time Calculator
 Ranking Gain Simulator
 Organic Traffic Value Calculator
 Organic Traffic Estimator and Website Traffic Checker
 LTV to CAC Ratio Calculator
 Local SEO ROI Calculator
 Link Building Cost Calculator
 Keyword Value Calculator
 Keyword Opportunity Score Calculator
 Keyword Density Calculator
 GEO ROI Calculator
 GEO Content Investment Calculator
 Ecommerce SEO ROI Calculator
 Customer Lifetime Value Calculator
 Customer Acquisition Cost Calculator
 CTR Calculator
 Cost Per Article Calculator
 Conversion Rate Calculator
 Content Marketing ROI Calculator
 ChatGPT Referral Traffic Estimator
 Bounce Rate Calculator
 Backlink ROI Calculator
 AI Visibility Score Calculator
 AI Traffic Value Calculator
 AI Share of Voice Calculator
 Cost of AI Invisibility Calculator
 AI Citation Rate Calculator
 llms.txt Validator
 AI Overview Checker and AI Overviews Rank Checker
 Robots.txt Checker
 AI SEO Audit
 LLM Readability Checker
 SearchGPT Readiness Checker
 Structured Data LLM Audit
 Website Crawlability AI Audit
 Why ChatGPT Is Not Recommending My Website
 Gemini Ranking Tool
 Perplexity Ranking Checker
 LLM Citation Checker
 Answer Engine Optimization Audit
 GEO Audit
 AI Search Visibility Test
 ChatGPT Visibility Checker
 llms.txt Generator
 URL Extractor
 Webpage to Markdown
 Sitemap Checker
 SERP Volatility Sensor
 Page Size Checker
 Word Counter
 Slug Generator
 Schema Generator
 Robots Generator
 OG Preview
 Meta Tags Generator
 Image Compressor
 Favicon Generator
 On-Page SEO Audit: SEO Checker and SEO Analyzer
 Backlink Analysis Tool
 Keyword Research Tool
 Domain Authority Checker
 “I tested Sorank on a real client site and it's insane. It does everything an agency would bill you $1500 a month for. It's going into production on that client now.”

 Guillaume Guersanguersanguillaume.com“We are an Ads agency and we wanted to get our SEO back on track once and for all. Sorank gave us a clear view of our site, helped us prioritize optimizations, and properly structure our content. The tool is easy to use, well designed for a team, and very practical for centralizing tracking without having to juggle multiple platforms. A very solid foundation to start fresh with our SEO.”
 Gaspard MadouiAds Agency
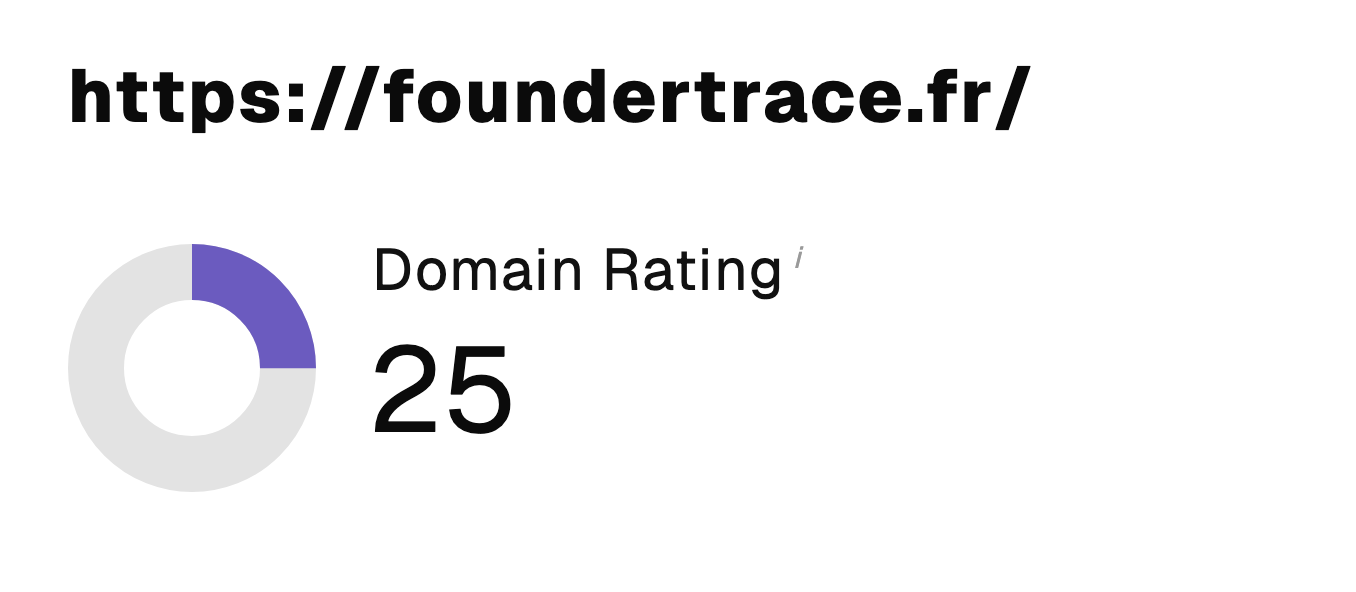 “I just let the Sorank software do its thing, and now my DR is 25 and my page is ranking higher.”
 Lucas Flandrefoundertrace.fr“I specialized in GEO thanks to Sorank. The GEO Leaderboard allows me to show my clients their position vs competitors on ChatGPT. It’s a real commercial differentiator.”
 MélanieSEO Freelance“Great service, works well for our website and helps us understand how to improve it to rank better on Google and elsewhere. Congrats, keep going, I recommend it.”
 Hugo T.E-commerce merchant