Preferences
Privacy is important to us, so you have the option of disabling certain types of storage that may not be necessary for the basic functioning of the website. Blocking categories may impact your experience on the website. More information
Privacy is important to us, so you have the option of disabling certain types of storage that may not be necessary for the basic functioning of the website. Blocking categories may impact your experience on the website. More information

B2B marketing statistics you can trust in 2026: buying committees, AI research and budgets, each with its source, and how to quote them correctly.

In short
B2B marketing statistics help you set priorities, but only when you know who answered, how many people did, and when the survey ran. The most useful 2026 figures come from buyer and marketer surveys that publish their method. Use them to test your assumptions, not as targets to copy into a plan. Open the original source before you quote any number.
Want to go further? Ask
Quick quiz
Which way of finding customers online fits you best?
Sorank matches your answers


Test it for 3 days on your own site and see where you stand on Google, ChatGPT and the other AIs.
Start 3-day free trial3 days free, then stop whenever you want. 90-day results guarantee, conditions apply.
A statistic is a number with three facts attached: who was measured, what they were asked, and when. Remove one of them and the number becomes a rumor. "60% of B2B marketers..." tells you nothing until you know the sample, the exact question and the year.
Most B2B figures fall into three groups. Buyer behavior shows how companies research and buy. Marketer behavior shows what teams do, spend and measure. Performance figures show what happens after a click: conversion, acquisition cost, sales cycle length. Each group needs its own kind of source. Mixing them is one of the most common errors in this topic, and the mistakes section below covers it.
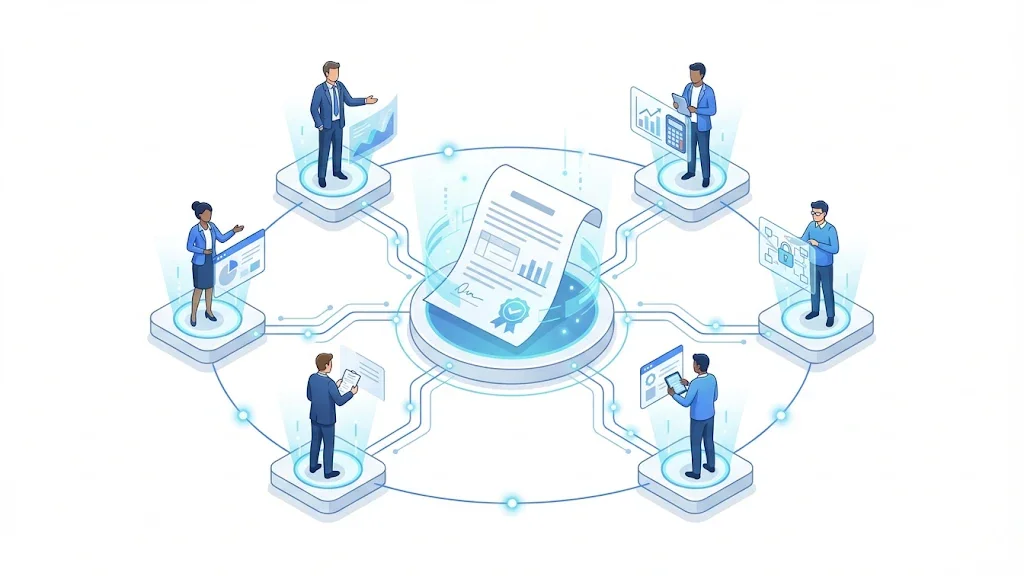
B2B purchases are group decisions. In its 2026 State of Business Buying research, Forrester reports that the typical buying decision now includes 13 internal stakeholders and nine external influencers. The same research says procurement professionals are decision-makers in 53% of business buying cycles.
That changes what a page must do. A single page for "the marketing manager" misses the finance approver, the IT reviewer and the procurement contact who can stop a deal. Each of them searches with different words, asks different questions and needs different proof. The page that answers the IT reviewer's question about data storage can decide a deal that the marketing manager already likes.
Who takes part in a B2B purchase
Source: Forrester, The State of Business Buying, 2026
You do not need a survey to start. Your last five to ten won deals already show who was involved. Work through them with the salespeople who ran the calls, because they remember the roles better than the CRM does.
Map your buying committee in five steps
For the wider view on personas, read buyer personas for SEO and AI search. For content that moves a whole committee, see B2B content marketing.
The second shift is where research starts. Forrester's Buyers' Journey Survey, 2025, found that 94% of business buyers use AI in their buying process, up from 89% the year before. Forrester's blog post on the same data adds that twice as many buyers now name generative AI or conversational search as their most important source of information, more than any other source.
Warning
A usage figure is not a sequence. "94% of buyers use AI" does not prove that they ask an AI tool before they search Google. Some roundups make that claim, and the Forrester data does not support it. Quote the number as what it measures.
The same Forrester press release reports that more than 60% of business buyers now use a trial, and that 78% of buyers making purchases of $10 million or more engage in a trial first. A trial is no longer the final step. For many buyers it sits inside the research phase, next to the AI answer and the vendor comparison.
Buyers now move between an AI answer, a vendor comparison and a trial before they talk to sales. Each step needs a page they can find and trust. A page that answers "is it worth a trial, and what do I get in the first week?" serves the buyer at the trial stage. A page on pricing logic serves the buyer who is comparing two vendors.
Check whether AI tools name your brand for your category before you commission new pages. The AI visibility audit guide explains how to run that check in ChatGPT, Gemini and Perplexity, and the answers tell you which competitors are named in your place.
The Content Marketing Institute and MarketingProfs surveyed 861 B2B marketers, with fieldwork from June 23 to August 11, 2026. Their report, B2B Content and Marketing Trends: Insights for 2027, is written by Robert Rose. The CMI article on the research gives the figures below. Respondents could pick several answers, so the bars add up to more than 100%.
Look at the last bar. Only 14% name AI-powered marketing applications as a factor in effectiveness. Adding an AI tool to a weak content process does not fix the process. Alignment with sales (26%) is a factor you can change without buying new software.
Headline effectiveness numbers need the same care. 60% of respondents rate their marketing as effective, but only 12% say it significantly exceeded goals. 48% say it was somewhat effective, and 30% say the results were mixed. A headline that says "60% effective" hides a large middle group.
The same survey reports that 82% of respondents allocated budget to content-led experiences in 2026. Use that as context for your own budget decision, not as a plan to copy. Experiences only pay when the follow-up is ready, and the survey does not measure that part.
For content figures across all industries, read content marketing statistics. This article covers the B2B side and focuses on how to read the numbers, so the two pieces work together.
AI is now a normal part of B2B content work. 88% of B2B marketers say their organization uses AI-powered content creation tools, and of those, 60% expanded that use compared with a year earlier. The same survey asked what AI contributes to their content. Speed came first. Quality came last.
Speed is easy to measure. Quality is not, and marketers say so. The challenges they name most often are ensuring accuracy (54%), maintaining quality control (54%) and keeping brand voice and authenticity (52%). 65% say they faced more pressure to produce content faster over the past 12 months. That pressure carries a risk: the faster the output, the easier it is for one weak page to slip through.
75% of marketers worry that AI makes audiences more skeptical of online content. Yet 52% say their organization has no policy on disclosing AI use, and only 8% disclose AI use on every piece. A one-sentence rule is enough to start. For example: "We say when AI wrote a first draft, and an editor checks every statistic before publication." Adapt the wording, but keep it short enough that a writer remembers it.
Run these four checks on every AI-assisted article before it goes live:
For a broader comparison of machine-written and human-written pages, see AI content vs human content.
The same survey asked about traffic. 31% of marketers saw an increase over the last 12 months, 31% saw a decrease, 24% saw no change, and 14% do not track it at all. Among those whose traffic fell, 79% blame AI-powered search.
That 79% is a perception, not a measurement. Before you accept it, split your traffic by source. Compare Google organic visits, referrals from AI tools and direct visits over the same weeks. If AI referrals are small, the decline comes from somewhere else. If they are large, you have a channel to manage, and you can start measuring it.
Track the two channels in one view, so the comparison is fair. The GEO / SEO dashboard shows Google and AI traffic in one view, and the AI mention tracking page covers when ChatGPT cites your brand. Compare the two over at least a quarter before you draw a conclusion.
Every B2B funnel needs a rule for crediting a deal to channels. No model is correct. Each one answers a different question and hides something else. Pick one, use it for at least a year, and compare trends only inside that model. The example below uses one deal: a buyer sees a paid ad, reads a blog post, attends a webinar and then requests a demo. For a longer guide, see marketing attribution.
Principle: the first interaction gets all the credit. In the example, the paid ad gets 100%. Use it when you want to know which channels start demand. Advantage: simple to set up and easy to explain. Limit: it ignores the blog post, the webinar and the demo, which all moved the deal forward.
Principle: the final interaction gets all the credit. In the example, the demo request gets 100%. Use it when you want to know which channels close deals. Advantage: it matches what sales sees on the last call. Limit: it erases the awareness work, so the blog post that started the deal looks useless.
Principle: every touch gets equal credit. In the example, each of the four touches gets 25%. Use it when you want a simple, balanced view and have no strong opinion yet. Advantage: nobody can argue that one channel was favored. Limit: a minor email gets the same weight as the demo request.
Principle: touches close to the conversion get more credit than older ones. In the example, the webinar and the demo get more than the ad. Use it when cycles are long and late steps decide the outcome. Advantage: it reflects the idea that recent touches matter more. Limit: the decay rate is a judgment call, so you must document it and keep it fixed.
Principle: the first and last touches get 40% each, and the middle touches share the remaining 20%. In the example that means 40% to the ad, 10% to the blog post, 10% to the webinar and 40% to the demo. Use it when you want credit for both awareness and closing. Advantage: it is a common middle ground for B2B teams. Limit: the 40/20/40 split is a convention, not a finding about buyers.
Principle: the model estimates each touch's credit from your own conversion paths. Use it when you have enough conversions to model, which many B2B companies do not. Advantage: it follows your data rather than a rule. Limit: it is hard to audit, and a small dataset gives unstable results from one month to the next.
| Model | Credit rule | Good for | Main limit |
|---|---|---|---|
| First-touch | All credit to the first interaction | Finding which channels start demand | Ignores everything that moved the deal forward |
| Last-touch | All credit to the final interaction | Finding which channels close | Erases awareness work |
| Linear | Equal credit to every touch | A simple, balanced first view | Gives minor touches the same weight as major ones |
| Time-decay | More credit to recent touches | Long cycles where late steps decide | The decay rate is a judgment call |
| Position-based | 40% first, 20% shared by the middle, 40% last | Teams that value both awareness and closing | The split is a convention, not a fact |
| Data-driven | Credit estimated from your conversion paths | Teams with enough conversions to model | Hard to audit and unstable on small data |
A survey tells you what others report. Your own numbers tell you what to do. Calculate the same ratios from your CRM each quarter, then compare them with the survey figures above. Use the surveys to decide where to look, and your data to decide what to change.
CAC is the total cost of acquiring customers in a period, divided by the number of new customers won in that same period. Include the salaries of the people who run acquisition, the tools they use and the paid media budget. If you leave out the people cost, your CAC will look better than it is.
CAC = sales and marketing cost in the period / new customers won in the same periodThis ratio compares what a customer is worth over time with what it cost to win them. Many teams use 3:1 as a first check. Treat it as a starting point, not a verdict, because margin, churn and contract length change the answer for each business.
LTV:CAC = customer lifetime value / CACThis rate shows how many leads reach a real sales conversation. Define the two terms in your CRM first, or the rate means nothing. A lead is a contact who gave you details. An opportunity is a deal your sales team has qualified. The two numbers come from different records.
Lead to opportunity rate = opportunities created / leads in the same periodThese inputs are invented, for arithmetic only. Suppose you spent 12000 in one quarter and won 8 new customers. Your CAC is 1500. If each customer is worth 4500 in gross margin over its lifetime, your LTV:CAC is 3.
CAC = 12000 / 8 = 1500LTV:CAC = 4500 / 1500 = 3Tip
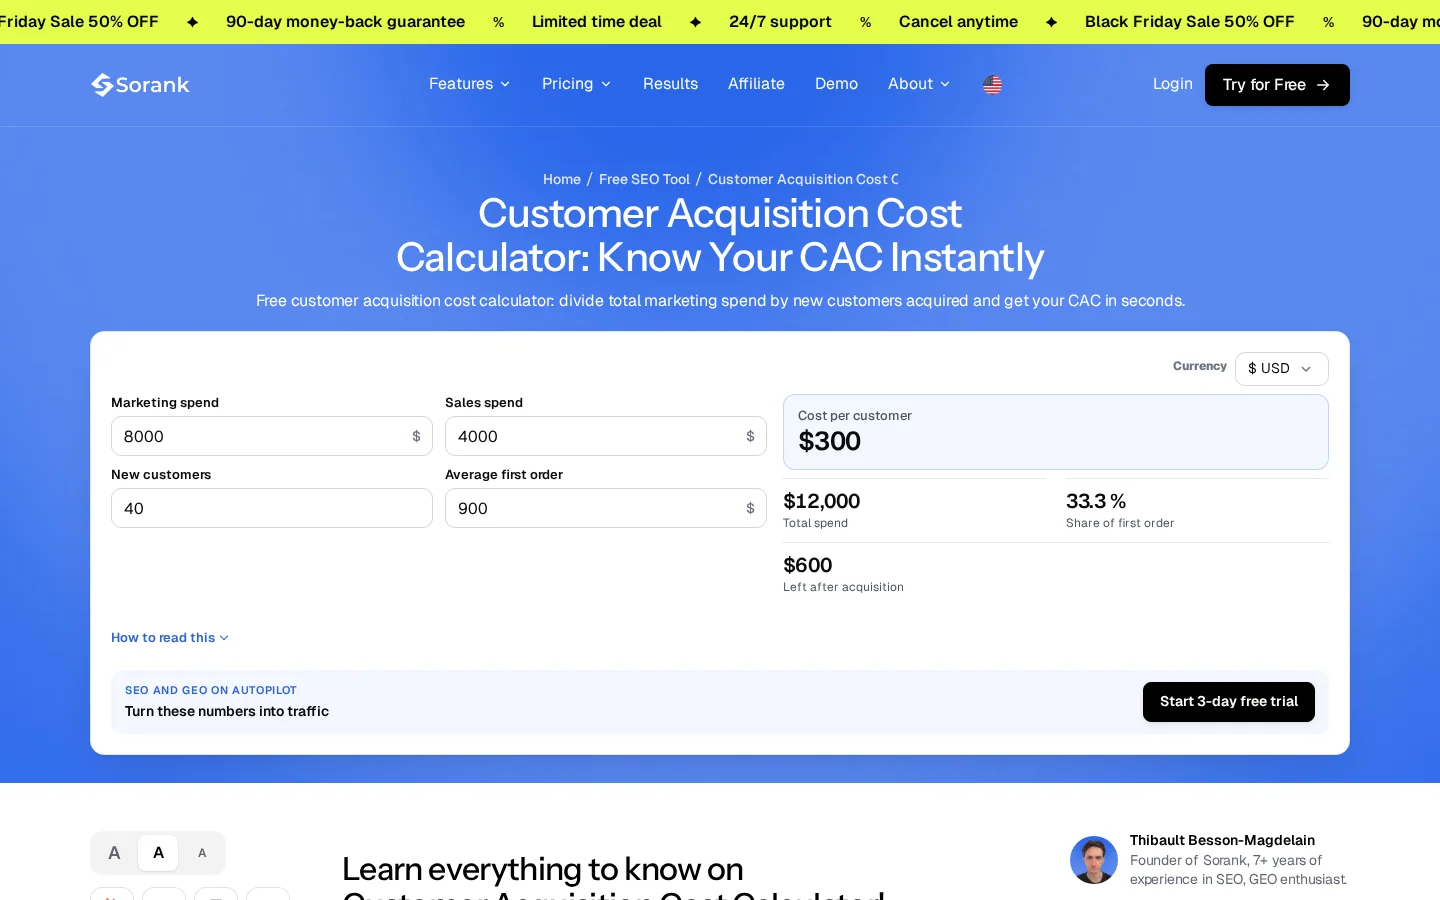
Sorank's free customer acquisition cost calculator does the first step for you. The LTV to CAC ratio calculator checks the second. Use your own figures, not the example above.
Keep one shared file with every figure you use. It stops the same weak number from returning in every new article, and it gives your editors a place to check. Use this method:
Build a statistics file in five steps
Quote it, or check it first
These mistakes appear in published B2B articles all the time. Each one is easy to spot once you know what to look for.
What it is: using the top-line figure when the full scale says something else. The "60% rate their marketing as effective" figure combines 12% who say highly effective with 48% who say somewhat effective. How to spot it: find the full answer scale in the report, and look for words like "somewhat", "neutral" or "mixed". How to fix it: quote the category you need, or write both: "12% highly effective, 60% effective in total".
What it is: treating answers that add up to more than 100% as if they were shares of one whole. The AI benefits list (speed 78%, efficiency 59%, volume 44% and so on) is a multi-select question. How to spot it: add the bars. A total above 100% means respondents chose several options. How to fix it: write "of respondents who selected this option" or "could select several".
What it is: claiming that one behavior happens before another, or causes it, because a survey measured both. The 94% AI usage figure does not show when buyers use AI or which tool they open first. How to spot it: look for "before", "because", "led to" or "caused" next to a survey figure. How to fix it: rewrite the sentence as what was measured. "94% of business buyers use AI in their buying process" is accurate. "Buyers ask AI before Google" is not in the data.
What it is: repeating a number from an aggregator that repeats another aggregator. In our search for B2B figures, the same numbers appeared on many roundups, several without a link to a primary report, and some sources disagreed on the year. How to spot it: the figure has no link to a report, or the link leads to another roundup. How to fix it: follow the chain until you reach the publisher, open the page and check the wording. If you cannot reach it, do not use the number.
What it is: dating a figure by the year the page was published. A report published in one year can use a survey run the year before, and a page can mix two years of data. How to spot it: look for "fielded" or "conducted" in the methodology section. How to fix it: write the fieldwork period in your file and in your article, for example "a survey fielded in summer 2026".
What it is: setting your goal to the survey average. An average across hundreds of companies says little about a 20-person software firm or a 300-person manufacturer. How to spot it: a benchmark appears in a plan with no reference to your size, segment or deal value. How to fix it: turn the benchmark into a question. "Why are we below the average?" leads to better work than "Our target is the average."
What it is: comparing a lead rate from one source with an opportunity rate from another. The two numbers look alike and mean different things. How to spot it: the stage names are not defined in the article or in your file. How to fix it: write each stage in one sentence, and use the same definitions in the CRM, the report and the article.
Not all sources deserve the same weight. Rank them before you quote them, and keep the weakest ones for finding leads to the strong ones.
| Source type | Example | Use it for | Check before using |
|---|---|---|---|
| Survey with a published method | CMI and MarketingProfs B2B research | Trends and benchmarks across many companies | Sample size, fieldwork dates and the exact question |
| Analyst research | Forrester's buyer surveys and press releases | Buyer behavior and how purchases are made | Whether the figure is in the release or only in the full report |
| Vendor research | Data from one software company's customers | Behavior inside that product or niche | Who the sample is and what the vendor sells |
| Roundup or aggregator | A blog that lists statistics from other blogs | Finding leads to the primary source | Whether the link leads to the original report |
| AI-generated answer | A chatbot reply that includes a number | Nothing on its own | Whether the number appears in a source you open |
Sorank is an SEO and GEO platform, so it helps with the traffic questions above. The marketing teams page describes how teams grow traffic from Google and AI together. Use your own dashboard to build a baseline, then compare it with the figures in this article. Your numbers will tell you more about your next step than any survey.
Before a figure goes into your article
Start with the original report, not a roundup. Look for a published method that gives the sample size, the fieldwork dates and the exact question. Forrester and the Content Marketing Institute publish research of this kind.
Forrester's 2026 State of Business Buying research reports 13 internal stakeholders and nine external influencers in a typical buying decision. Procurement professionals are decision-makers in 53% of cycles. Map the roles in your own won deals to see your version.
Forrester's Buyers' Journey Survey, 2025, found that 94% of business buyers use AI in their buying process, up from 89% the year before. That measures usage, not the order of steps, so quote it as usage.
We analyse your competitors, your website and your AI visibility to create a tailored content plan for free.
 AI Content Brief Generator
 FAQ Schema Generator
 AI Blog Post Ideas Generator
 Structured Data Validator (Schema Validator)
 Alt Text Checker
 Internal Link Analyzer
 Backlink Challenge
 AI Meta Description Generator
 AI Blog Title Generator
 Google Indexability Checker
 AI Blog Outline Generator
 UTM Link Builder
 Keyword Clustering Tool
 Canonical Tag Checker
 XML Sitemap Generator
 Broken Link Checker
 AI SEO Title Generator
 Headline Analyzer
 SERP Preview Tool
 Redirect Checker
 Hreflang Tag Generator
 Heading Structure Analyzer
 HTTP Headers Checker
 Favicon Extractor
 SERP CTR Calculator
 SEO vs Paid Search Savings Calculator
 SEO Share of Voice Calculator
 SEO ROI Calculator
 SEO Traffic and Revenue Forecast Calculator
 SEO Budget Calculator
 SEO Break-Even Calculator
 SaaS SEO ROI Calculator
 ROAS Calculator
 Reading Time Calculator
 Ranking Gain Simulator
 Organic Traffic Value Calculator
 Organic Traffic Estimator and Website Traffic Checker
 LTV to CAC Ratio Calculator
 Local SEO ROI Calculator
 Link Building Cost Calculator
 Keyword Value Calculator
 Keyword Opportunity Score Calculator
 Keyword Density Calculator
 GEO ROI Calculator
 GEO Content Investment Calculator
 Ecommerce SEO ROI Calculator
 Customer Lifetime Value Calculator
 Customer Acquisition Cost Calculator
 CTR Calculator
 Cost Per Article Calculator
 Conversion Rate Calculator
 Content Marketing ROI Calculator
 ChatGPT Referral Traffic Estimator
 Bounce Rate Calculator
 Backlink ROI Calculator
 AI Visibility Score Calculator
 AI Traffic Value Calculator
 AI Share of Voice Calculator
 Cost of AI Invisibility Calculator
 AI Citation Rate Calculator
 llms.txt Validator
 AI Overview Checker and AI Overviews Rank Checker
 Robots.txt Checker
 AI SEO Audit
 LLM Readability Checker
 SearchGPT Readiness Checker
 Structured Data LLM Audit
 Website Crawlability AI Audit
 Why ChatGPT Is Not Recommending My Website
 Gemini Ranking Tool
 Perplexity Ranking Checker
 LLM Citation Checker
 Answer Engine Optimization Audit
 GEO Audit
 AI Search Visibility Test
 ChatGPT Visibility Checker
 llms.txt Generator
 URL Extractor
 Webpage to Markdown
 Sitemap Checker
 SERP Volatility Sensor
 Page Size Checker
 Word Counter
 Slug Generator
 Schema Generator
 Robots Generator
 OG Preview
 Meta Tags Generator
 Image Compressor
 Favicon Generator
 On-Page SEO Audit: SEO Checker and SEO Analyzer
 Backlink Analysis Tool
 Keyword Research Tool
 Domain Authority Checker
 “I tested Sorank on a real client site and it's insane. It does everything an agency would bill you $1500 a month for. It's going into production on that client now.”

 Guillaume Guersanguersanguillaume.com“We are an Ads agency and we wanted to get our SEO back on track once and for all. Sorank gave us a clear view of our site, helped us prioritize optimizations, and properly structure our content. The tool is easy to use, well designed for a team, and very practical for centralizing tracking without having to juggle multiple platforms. A very solid foundation to start fresh with our SEO.”
 Gaspard MadouiAds Agency
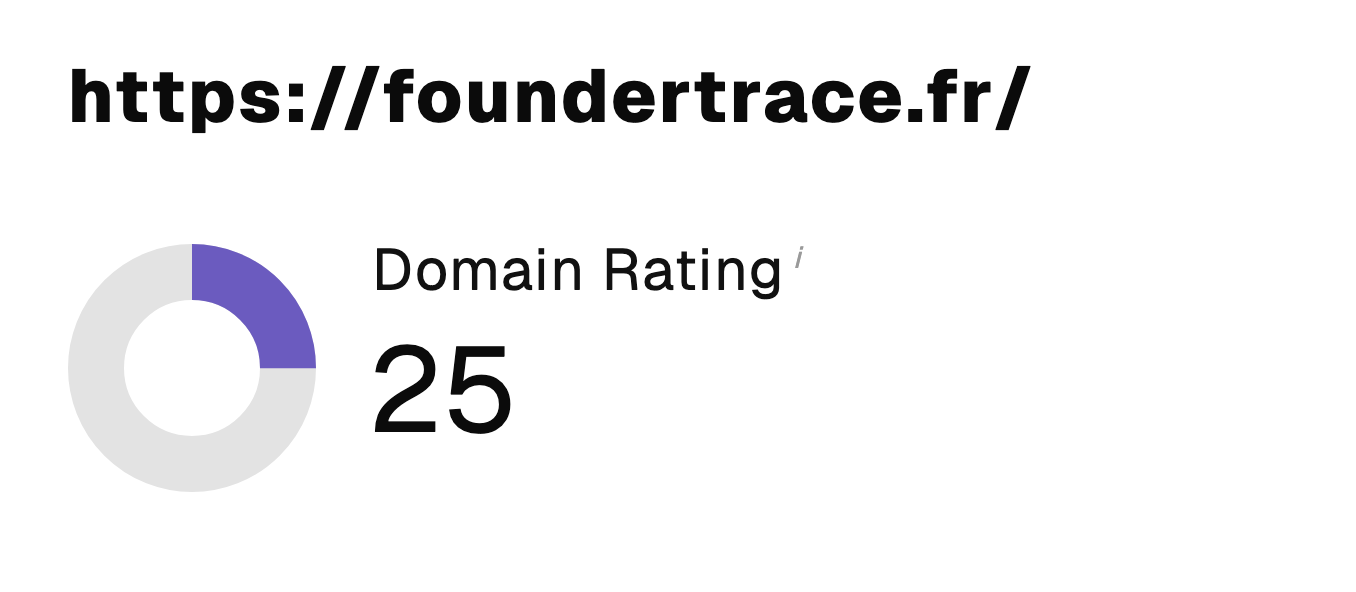 “I just let the Sorank software do its thing, and now my DR is 25 and my page is ranking higher.”
 Lucas Flandrefoundertrace.fr“I specialized in GEO thanks to Sorank. The GEO Leaderboard allows me to show my clients their position vs competitors on ChatGPT. It’s a real commercial differentiator.”
 MélanieSEO Freelance“Great service, works well for our website and helps us understand how to improve it to rank better on Google and elsewhere. Congrats, keep going, I recommend it.”
 Hugo T.E-commerce merchant