
Preferences
Privacy is important to us, so you have the option of disabling certain types of storage that may not be necessary for the basic functioning of the website. Blocking categories may impact your experience on the website. More information
Privacy is important to us, so you have the option of disabling certain types of storage that may not be necessary for the basic functioning of the website. Blocking categories may impact your experience on the website. More information

Learn the conversion metrics that matter: rate formulas, revenue per visit, macro vs micro conversions, attribution models and the errors that break reports.

In short
A conversion metric counts the visits, users or clicks that end in an action you care about. A conversion rate divides that count by the traffic that could have converted. Pick one main conversion (a purchase, a booked call, a paid trial), track its rate by channel and by landing page, and compare each number with your own past periods. Published benchmarks help you orient yourself, but they should not set your target.
Want to go further? Ask
Quick quiz
Which way of finding customers online fits you best?
Sorank matches your answers


Test it for 3 days on your own site and see where you stand on Google, ChatGPT and the other AIs.
Start 3-day free trial3 days free, then stop whenever you want. 90-day results guarantee, conditions apply.
A conversion is any action that moves a visitor closer to revenue. For an online shop it is usually a purchase. For a consultant it may be a contact form or a booked call. The metric is the count of those actions, and the rate is that count divided by the people or visits that had the chance to act.
Most confusion comes from mixing up three ideas. A count tells you volume. A rate tells you efficiency. A value tells you money. You need all three, and you should read them in that order. A rising count with a falling rate usually means you bought more traffic, not that you got better traffic.
| Metric | What it counts | Typical formula | Question it answers |
|---|---|---|---|
| Conversions | Completed actions | Count of events | How many people did it? |
| Conversion rate | Share of visits or users that converted | Conversions / visits x 100 | How well does this traffic convert? |
| Conversion value | Money attached to the conversions | Revenue / number of orders | How much is each action worth? |
The formula itself is simple. The hard part is choosing the denominator, the number you divide by. Three versions show up in most reports, and they give different answers from the same data:
Conversion rate per visit = conversions / visits x 100
Conversion rate per user  = users who converted / total users x 100
Conversion rate per click = conversions / ad clicks x 100
Google Ads uses the click version. Its help page defines conversion rate as the average number of conversions per ad interaction, and it gives an example: 50 conversions from 1000 interactions gives 5%. The same page says the rate can go above 100% when you count more than one conversion per click (Google Ads Help, conversion rate definition).
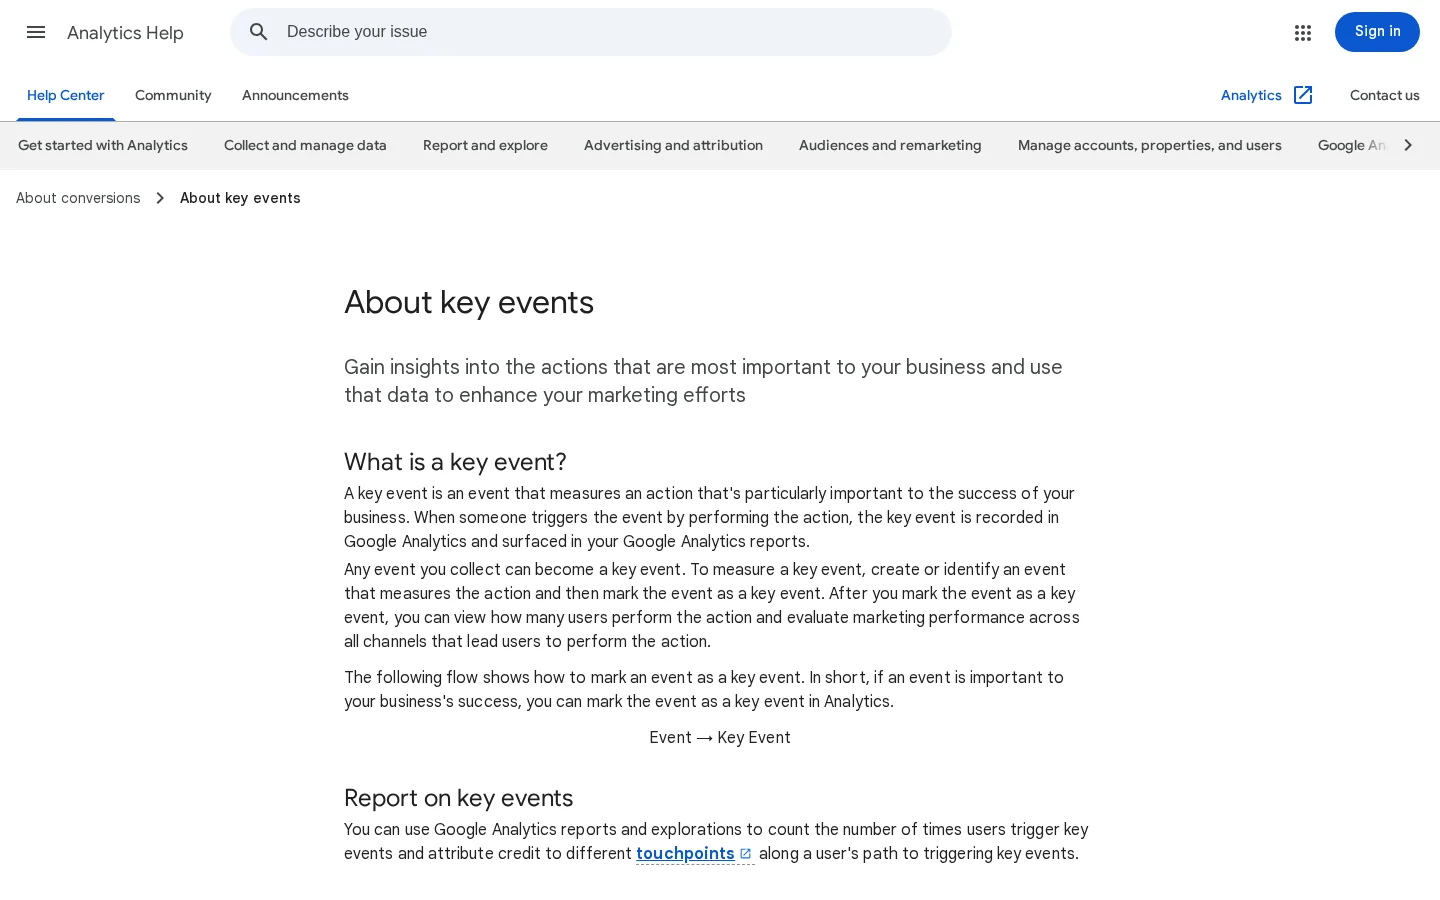
Google Analytics 4 works differently. Its reports call conversions "key events", and it defines a key event as "an event that measures an action that's particularly important to the success of your business." The session version of the rate is the share of sessions in which a key event happened (Google Analytics Help, About key events).
Session rate or user rate?
Here is a worked example. A shop receives 10000 visits in a month, and 250 of them end in a purchase. The rate per visit is 250 / 10000 x 100 = 2.5%. If you count users instead, the number changes as soon as one customer buys twice. That is not an error. It means the two versions answer two different questions. Write down which one you report, and use the same one in every dashboard, or two people will read two different rates from the same data.
Example
Same shop, same month: 250 orders, 10000 visits, 2.5% per visit. Ad platforms, however, will show you a rate per click, and that denominator is usually much smaller than the number of visits. A campaign with 1000 clicks and 50 conversions shows 5%, even if the site as a whole converts at 2.5%. Neither number is wrong. They measure different things.
A rate with no value attached can mislead you. A higher rate on a cheap product can earn less money than a lower rate on an expensive one. That is why the conversion rate should always sit next to the value of each conversion, which we cover in the revenue section below. The two numbers work as a pair: the rate tells you how often people act, and the value tells you what each action is worth.

Macro conversions are the actions tied directly to revenue: a purchase, a qualified lead, a paid subscription. Micro conversions are the steps on the way there: an add to cart, a newsletter signup, a view of the pricing page, a video watched to the end. Micro conversions help you find friction early, but they can mislead you. They can grow every month while revenue stays flat.
| Type | Examples | Good for | Risk |
|---|---|---|---|
| Macro | Purchase, booked call, paid trial | Revenue and return on spend | Slow to move, small counts on low-traffic sites |
| Micro | Add to cart, signup, pricing page view | Finding friction early | Can grow while revenue stays flat |
Pick the single action that finishes your business goal, and write its definition in one line. For example: "A conversion is a payment confirmed on the order thank-you page, excluding test orders and refunded orders." A definition like this also tells you what does not count. A form that fails validation, a double submit, or a click on the "submit" button without a server response should not be counted as a conversion.
If your business has several outcomes that matter, such as sales and demo requests, keep one primary conversion for the headline rate and report the others in a separate table. Mixing them into one number makes the rate impossible to act on.
Micro conversions are most useful when you read them as ratios between steps. If add to cart stays healthy and purchase falls, the problem is after the cart. If the pricing page is viewed often but demo requests stay flat, the page is attracting the wrong visitors or failing to answer their next question. The micro step tells you where to look. The macro rate tells you whether it matters.
For a practical list of levers you can test once you find the weak step, read how to increase conversion rate, and for the broader picture of how search and conversion work together, see SEO and CRO.
Value turns a rate into money. Four metrics do most of the work, and each has a formula you can check against your own accounting data. The table below lists them with the question each one answers.
| Metric | Formula | What it tells you |
|---|---|---|
| Average order value | Revenue / number of orders | How much a buyer spends per order |
| Revenue per visit | Revenue / visits | The value of one visit, comparable across channels |
| Customer acquisition cost | Acquisition spend / new customers | What one new customer costs you |
| Customer lifetime value | Average order value x purchases per year x years retained | What a customer is worth over time |
Revenue is the product of three levers, which makes them easy to test one at a time:
Revenue per visit = revenue / visits
Revenue           = visits x conversion rate x average order value
Take the shop from earlier. Its 10000 visits, 250 orders and an average order value of 80 give 250 x 80 = 20000 in revenue, which is 2.00 per visit. If a change lifts the conversion rate to 3% with the same traffic and order value, revenue rises to 300 x 80 = 24000. The same formula shows the effect of a price change or a bundle, because it moves the third lever. This is why a single conversion rate never tells the full story.
Tip
Before you set a target, run your own numbers through the conversion rate calculator. A target based on your traffic and order value is far more useful than one copied from a blog post.
Ecommerce teams also track the rest of the margin stack. The ecommerce KPIs guide lists the metrics and where to find them, and the PPC metrics guide explains how the cost side (cost per click, cost per conversion, return on ad spend) connects to the conversion rate you are reading here.
A final conversion rate hides where people leave. A shop can lose most of its buyers in the cart, not on the product page, and a single rate will not tell you that. Cart abandonment is the classic example, and it is one of the best-studied numbers in ecommerce.
The Baymard Institute, which tests checkout flows, publishes an average cart abandonment rate of 70.22%. The figure is an unweighted average of 50 studies published between 2006 and 2025, and the page was updated in October 2026 (Baymard Institute, cart abandonment rate). Use it to decide where to look, not as a target. Averages hide wide differences between sites, so your own checkout data matters more.
Cart abandonment in numbers
Source: Baymard Institute, cart abandonment rate, updated October 2026
The reasons people give are more useful than the rate itself, because each reason points to a specific fix. The same Baymard page lists the top reasons. Extra costs such as shipping, tax and fees come first. Showing the total cost early, on the product page or in the cart, is the first test to run against your own step rates.
Count each step over the same period and the same users. Then divide each step by the one before it. The step rate tells you which transition loses the most people, and it is the number to watch after you change something.
Step rate = users who reach step n+1 / users who reach step n x 100Set the steps in the order a buyer takes them: landing page, product page, cart, checkout, payment confirmed. Keep the definitions identical across months. If you change what counts as "product page view" in March, your February and March rates no longer compare, and the drop you see in March may be a tracking change, not a behaviour change.
A conversion rarely follows one visit. A buyer may read a blog post, click a paid ad a week later, then search the brand name and buy. The attribution model decides which of those touches gets the credit. The choice matters when you compare channels, because the same sale can make one channel look strong and another look useless.
No model is correct. Each one answers a different question, and each one has a bias. The six models below are the ones you will meet in most analytics and ad tools.
All the credit goes to the last channel before the conversion. Use it when you want a simple view of which channel closes sales, and when your team needs a number that anyone can reproduce by hand. Its limit is that it ignores the discovery work. In the example of the buyer above, brand search gets 100% of the credit, even though the blog post and the ad made the search happen.
All the credit goes to the first touch. Use it to see which channels create new demand, for example content that brings people to the brand for the first time. Its limit is the mirror image of last click: it ignores what closed the sale. In the same example, the blog post gets 100% of the credit.
Every touch gets an equal share. Use it as a fair baseline when you want to see the whole journey without favouring either end. Its limit is that it treats a passing impression as strongly as a decisive search. In the example, the blog post, the ad and the brand search each get one third.
Touches closer to the conversion get more credit, and the weight falls as the touch gets older. Use it for short sales cycles, where the last few touches really do matter most. Its limit is that it undervalues early research, which is the main problem in long B2B cycles where the first touch may be months old.
The first and last touches get a fixed share, and the middle touches split the rest. Many tools default to something like 40% for the first touch, 40% for the last, and 20% spread across the middle. Use it when you value both discovery and closing. Its limit is that the split is a convention, not a fact about your buyers, so the numbers depend on a choice someone made.
The model learns the credit from your own conversion paths, comparing the journeys that converted with those that did not. Use it when you have enough conversions in the account for the model to learn from. Its limits are that it is hard to audit by hand and that it needs volume. With a few dozen conversions a month, the result is mostly noise.
| Model | Credit goes to | Best for | Main limit |
|---|---|---|---|
| Last click | Last touch | A quick view of closing channels | Overrates brand search |
| First click | First touch | Seeing where demand starts | Ignores what closed the sale |
| Linear | Every touch equally | A fair baseline across the journey | Treats weak touches as strong |
| Time decay | Touches near the sale | Short sales cycles | Undervalues early research |
| Position based | First and last touches, rest shared | Valuing discovery and closing | The split is a convention |
| Data-driven | Learned from your own paths | Accounts with volume | Hard to audit by hand |
Note
Compare at least two models over the same period before you move budget. If last click and data-driven agree, act on the result. If they disagree by a wide margin, the channel is probably working at a different stage of the journey than your model assumes, and you need more data before you decide.
For the full set of models and how to read them in your reports, see the marketing attribution guide.
Follow these five steps in order. Skipping the first one is the most common reason a report cannot be trusted, because every later step inherits the definition you chose.
Five steps to a conversion metric you can trust
The platform-specific setup for GA4, Google Ads and Meta is covered in the conversion tracking guide. This article covers what the numbers mean once they are in place. In GA4, the key event setup and the counting method are on the event itself, and Google's help page explains both.
Check the event before you trust it. Open the debug view, complete one purchase or one form submission yourself, and confirm the event appears once, with the right value and currency. A thank-you page that reloads will fire the event again on every load, so test the reload too. If the event fires twice, your conversion count is inflated from the first day, and the rate you see is wrong from that point on.
Warning
Do not change the definition in the middle of a comparison period. If you move the event from "order placed" to "payment confirmed" in March, your February and March rates measure two different things. Write the change in your report notes and, if you can, keep the old event running alongside the new one for a few weeks.
A site-wide rate is a blend. A 3% average can hide a landing page at 0.5% and another at 6%, and the fix for each is different. Segmentation tells you which group needs attention, so break the rate down before you act on it. Stop at the segments that have enough volume to read.
| Segment | Question it answers | What to check |
|---|---|---|
| Channel | Which sources bring buyers? | Compare paid, organic and referral on the same period and the same attribution model |
| Device | Does mobile convert far below desktop? | Compare the rate and the checkout errors by device |
| New or returning | Do first-time visitors need more trust signals? | Compare the gap between the two groups over time |
| Landing page | Which entry page loses people? | Sort pages by visits, then fix the high-traffic pages with low rates first |
| Country | Are price, shipping or language the blocker? | Check currency, delivery options and translated checkout text |
Small samples deserve their own warning. Three orders from 40 visits is a 7.5% rate, and a single extra order moves it by 2.5 points. That swing is larger than most of the changes you will test. Set a minimum volume before you act, such as a number of visits or conversions per segment that you agree on in advance, and report segments below it as "not enough data" rather than as a trend.
Each mistake below has three parts: what it is, how to spot it, and how to fix it. Most of them come from the denominator, the definition or the counting, not from the maths.
Some guides divide the total count of conversion events by the number of sessions. That counts events, not sessions, so one session with two purchases pushes the number up. It can differ from the session key event rate that GA4 reports for the same range and segment. To spot it, compare your calculated figure with the GA4 report for the same dates. If they differ, the two numbers measure different things. To fix it, choose one definition, write it in the report title, and use it in every dashboard.
Google Ads can show a conversion rate above 100% when you count every conversion, or when one click can produce several conversions. Google's help page says so directly. To spot it, look for a rate column that reads above 100%. To fix it, measure the action as one conversion per click when you want a rate, and report the total conversions as a separate number.
A thank-you page fires its event on every load. A customer who refreshes the page, or who returns with the back button, adds another conversion. To spot it, look for the same order ID appearing twice in your data, or for key events that exceed the number of orders in your shop. To fix it, fire the event only after the order is confirmed on the server, and deduplicate on the order ID.
Your team's tests and staff purchases enter the counts and inflate the rate. To spot it, look for conversion spikes on days with no campaign, or for orders with test names and no shipping address. To fix it, exclude internal traffic in a filtered view, cancel test orders in your shop, and keep a log of the dates when testing happened, so you can explain the spikes later.
Attribution windows control how long a touch can get credit for a later conversion. A channel measured with a 30-day window and another measured with a 90-day window cannot be compared directly. The default lookback window in GA4 for most key events has been 90 days, so check the setting in your property before you compare a channel with a different window. To spot it, check whether the sums of conversions by channel match your sales, and whether the gaps shrink when you change the window. To fix it, use one window across every comparison and write it next to the number.
A landing page with 3 orders from 40 visits looks like a 7.5% trend. One order more or less changes the result by 2.5 points, which is enough to make a poor page look good or a good page look poor. To spot it, check the count behind each rate before you read it. To fix it, set a minimum volume before you report a change, and show the count next to the rate in every table.
A conversion rate can improve while the cost per conversion gets worse, because the cheap clicks converted and the expensive ones did not, or because the spend rose. To spot it, look at the rate and the cost side by side. If the rate rises and the cost rises faster, the campaign is buying a different audience. To fix it, read the rate, the cost and the value together, and decide on margin, not on the rate alone.
Some visits that start in an AI answer arrive with no referrer and land in direct traffic. Your direct traffic then rises for no reason you can see in your campaigns. To spot it, look for landing pages that receive visits no campaign explains, especially after your brand is mentioned in AI answers. To fix it, tag the links you control, read the AI dark traffic guide, and track the AI sources you can identify as their own rows.
Before you trust a conversion rate
AI assistants now send visitors to websites. ChatGPT, Gemini, Claude and Perplexity answers can name your brand and link to your pages, and those visits deserve their own rows in your report, because their conversion behaviour can differ from search. Start by measuring the visits from each assistant you can identify, then compare their conversion rate with organic search on the same landing pages.
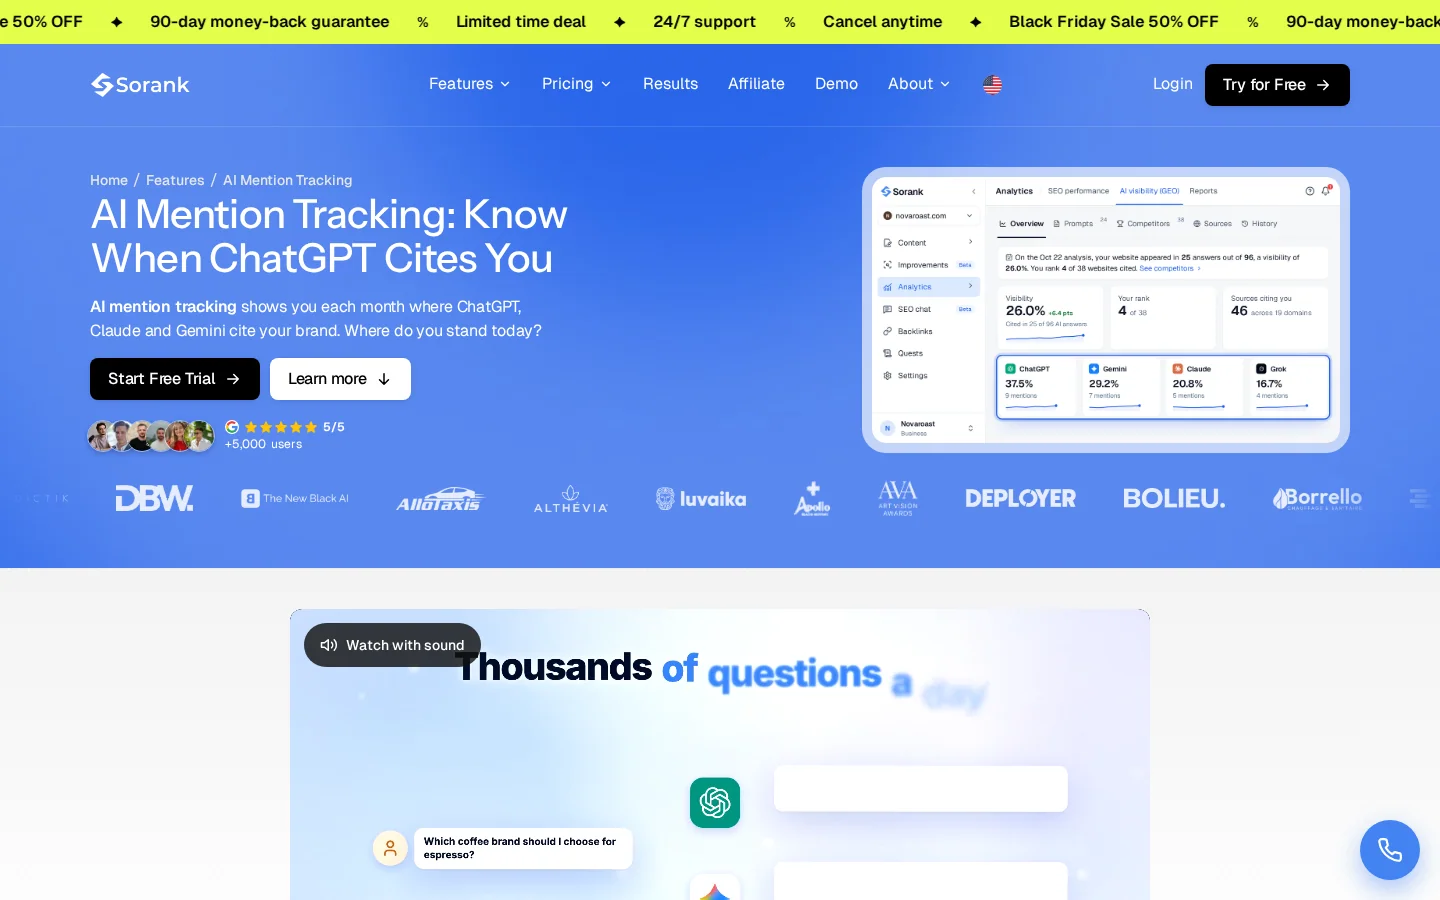
The mention comes before the visit, and it is also worth measuring. Sorank's AI mention tracking shows when ChatGPT cites your brand, so you can connect a change in mentions with a change in visits and conversions, instead of guessing from the traffic report alone.
Keep the comparison fair. An AI visit that lands on a product page is not the same as a search visit that lands on a blog post, so compare like with like: the same landing page type, the same device mix and the same period.
A dashboard that tries to show everything gets ignored. Keep it to six or eight numbers that you can act on: the primary conversion rate, the conversion value, the rate by channel, the rate by landing page for the top pages, the step rates of your funnel, and the number of conversions next to each rate. Add one line for the attribution model and the window. The marketing dashboard guide explains how to build the layout, and the SEO KPIs guide lists the search metrics that belong next to the conversion rate.
If your traffic comes mostly from search and AI, you can also use the GEO and SEO dashboard from Sorank to see Google and AI traffic in one view. Use it to check the trend, then go back to the step rates above to find the cause.
Tip
Write your conversion rate definition in the first line of the dashboard, not in a separate document. The rate is only as good as the definition that everyone reads with it.
Once the definition, the events and the segments are in place, the next question is what to change. The conversion rate optimization glossary gives the vocabulary, and the increase conversion rate guide gives the levers to test, one at a time, against the baseline you saved.
There is no universal good rate, because it depends on the offer, the price and the traffic source. Compare your rate with your own past periods and with the same channel, and use published averages only as a rough reference.
The conversion rate is the share of visits or users that convert. The conversion value is the money attached to those conversions. A high rate on a low-value action can earn less than a lower rate on a high-value one, so read both together.
Yes, if the form leads to a sale or a qualified next step. Count each submission once, and exclude spam or unqualified leads, because they raise the rate without adding revenue.
We analyse your competitors, your website and your AI visibility to create a tailored content plan for free.
 AI Content Brief Generator
 FAQ Schema Generator
 AI Blog Post Ideas Generator
 Structured Data Validator (Schema Validator)
 Alt Text Checker
 Internal Link Analyzer
 Backlink Challenge
 AI Meta Description Generator
 AI Blog Title Generator
 Google Indexability Checker
 AI Blog Outline Generator
 UTM Link Builder
 Keyword Clustering Tool
 Canonical Tag Checker
 XML Sitemap Generator
 Broken Link Checker
 AI SEO Title Generator
 Headline Analyzer
 SERP Preview Tool
 Redirect Checker
 Hreflang Tag Generator
 Heading Structure Analyzer
 HTTP Headers Checker
 Favicon Extractor
 SERP CTR Calculator
 SEO vs Paid Search Savings Calculator
 SEO Share of Voice Calculator
 SEO ROI Calculator
 SEO Traffic and Revenue Forecast Calculator
 SEO Budget Calculator
 SEO Break-Even Calculator
 SaaS SEO ROI Calculator
 ROAS Calculator
 Reading Time Calculator
 Ranking Gain Simulator
 Organic Traffic Value Calculator
 Organic Traffic Estimator and Website Traffic Checker
 LTV to CAC Ratio Calculator
 Local SEO ROI Calculator
 Link Building Cost Calculator
 Keyword Value Calculator
 Keyword Opportunity Score Calculator
 Keyword Density Calculator
 GEO ROI Calculator
 GEO Content Investment Calculator
 Ecommerce SEO ROI Calculator
 Customer Lifetime Value Calculator
 Customer Acquisition Cost Calculator
 CTR Calculator
 Cost Per Article Calculator
 Conversion Rate Calculator
 Content Marketing ROI Calculator
 ChatGPT Referral Traffic Estimator
 Bounce Rate Calculator
 Backlink ROI Calculator
 AI Visibility Score Calculator
 AI Traffic Value Calculator
 AI Share of Voice Calculator
 Cost of AI Invisibility Calculator
 AI Citation Rate Calculator
 llms.txt Validator
 AI Overview Checker and AI Overviews Rank Checker
 Robots.txt Checker
 AI SEO Audit
 LLM Readability Checker
 SearchGPT Readiness Checker
 Structured Data LLM Audit
 Website Crawlability AI Audit
 Why ChatGPT Is Not Recommending My Website
 Gemini Ranking Tool
 Perplexity Ranking Checker
 LLM Citation Checker
 Answer Engine Optimization Audit
 GEO Audit
 AI Search Visibility Test
 ChatGPT Visibility Checker
 llms.txt Generator
 URL Extractor
 Webpage to Markdown
 Sitemap Checker
 SERP Volatility Sensor
 Page Size Checker
 Word Counter
 Slug Generator
 Schema Generator
 Robots Generator
 OG Preview
 Meta Tags Generator
 Image Compressor
 Favicon Generator
 On-Page SEO Audit: SEO Checker and SEO Analyzer
 Backlink Analysis Tool
 Keyword Research Tool
 Domain Authority Checker
 “I tested Sorank on a real client site and it's insane. It does everything an agency would bill you $1500 a month for. It's going into production on that client now.”

 Guillaume Guersanguersanguillaume.com“We are an Ads agency and we wanted to get our SEO back on track once and for all. Sorank gave us a clear view of our site, helped us prioritize optimizations, and properly structure our content. The tool is easy to use, well designed for a team, and very practical for centralizing tracking without having to juggle multiple platforms. A very solid foundation to start fresh with our SEO.”
 Gaspard MadouiAds Agency
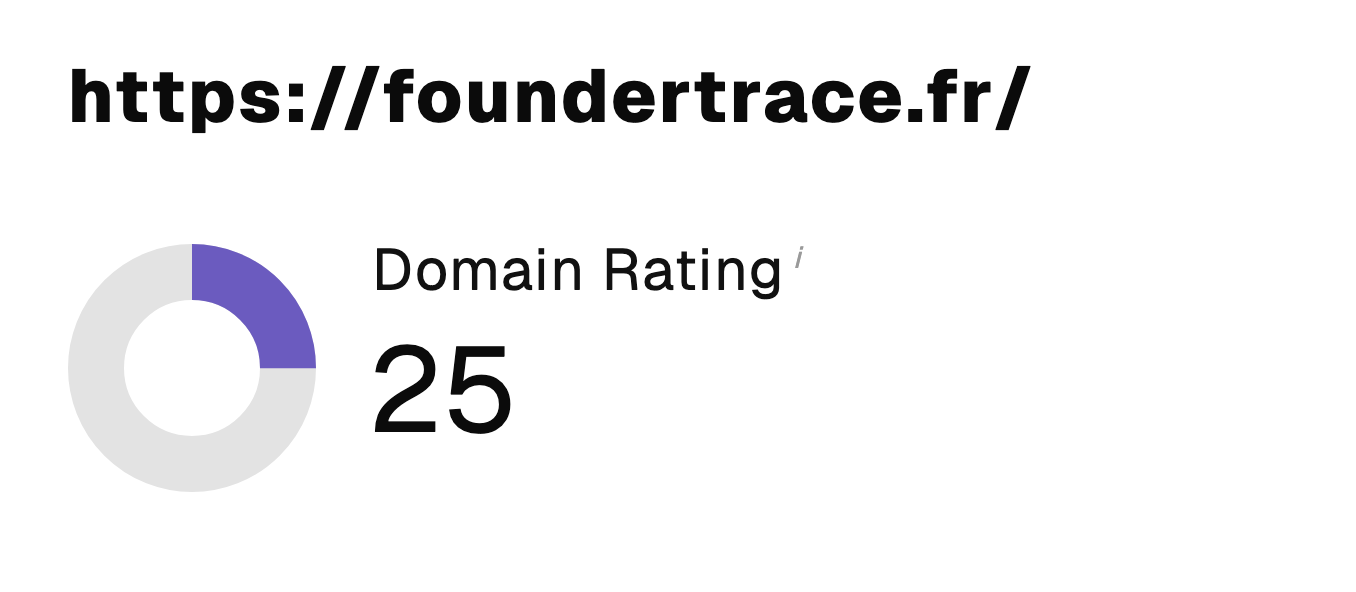 “I just let the Sorank software do its thing, and now my DR is 25 and my page is ranking higher.”
 Lucas Flandrefoundertrace.fr“I specialized in GEO thanks to Sorank. The GEO Leaderboard allows me to show my clients their position vs competitors on ChatGPT. It’s a real commercial differentiator.”
 MélanieSEO Freelance“Great service, works well for our website and helps us understand how to improve it to rank better on Google and elsewhere. Congrats, keep going, I recommend it.”
 Hugo T.E-commerce merchant