Preferences
Privacy is important to us, so you have the option of disabling certain types of storage that may not be necessary for the basic functioning of the website. Blocking categories may impact your experience on the website. More information

Privacy is important to us, so you have the option of disabling certain types of storage that may not be necessary for the basic functioning of the website. Blocking categories may impact your experience on the website. More information

PPC metrics explained: 15 paid search KPIs with formulas, which ones to track for each goal, sourced 2026 benchmarks and the warning signs that call for action.

Tools


In short
PPC metrics measure three stages of a paid campaign: visibility (impressions, impression share), engagement (clicks, CTR, CPC) and results (conversions, conversion rate, CPA, conversion value, ROAS). Pick one main KPI tied to your goal, CPA for leads or ROAS for e-commerce, and read the other metrics as diagnostics that explain why it moves. Benchmarks help to spot outliers, but your own history and your margins decide what a good number is.
Want to go further? Ask
A paid search account produces dozens of columns, and most of them are only useful when something goes wrong. PPC metrics are worth tracking when each one answers a question: are the ads seen, are they clicked, do the clicks convert, and does the money come back? This guide gives the 15 indicators that matter for pay-per-click advertising on Google Ads and Microsoft Ads, their formula, the warning sign to watch, and which ones to put first depending on your goal.
The table groups the 15 metrics by stage. The formulas are the ones used in Google Ads; the warning signs are the patterns that call for action.
| KPI | Formula | Warning sign |
|---|---|---|
| Impressions | Number of times an ad is shown | Sudden drop: budget, disapproved ads, bid or targeting change |
| Search impression share | Impressions / eligible impressions | Low share on your best converting campaigns |
| Search lost impression share (budget) | Share of eligible impressions missed for lack of budget | Above zero on a campaign with a profitable CPA |
| Search lost impression share (rank) | Share missed because of a low Ad Rank | High and rising: bids or ad quality too low |
| Top and absolute top impression rate | Impressions among the top ads (or as the very first ad) / impressions | Falling on brand campaigns |
| Clicks | Number of clicks on the ads | Clicks rise faster than conversions |
| Click-through rate (CTR) | Clicks / impressions | Low CTR on keywords that should be relevant |
| Average cost per click (CPC) | Cost / clicks | Rising CPC with a stable conversion rate |
| Cost per thousand impressions (CPM) | Cost / impressions x 1,000 | Rising CPM on Display, Video or Demand Gen |
| Conversions | Number of tracked conversion actions | Drop with stable clicks: tracking or landing page issue |
| Conversion rate | Conversions / interactions (clicks) | Decline after a site or landing page change |
| Cost per acquisition (CPA) | Cost / conversions | Above the margin you can afford per customer |
| Conversion value | Sum of the values of the conversions | Missing or identical values on every conversion |
| Return on ad spend (ROAS) | Conversion value / cost | Below your break-even ROAS |
| Quality Score | Score from 1 to 10 per keyword | Scores of 1 to 4 on keywords with high spend |
Two other metrics complete this list for specific cases: frequency (average number of times one person sees an ad) on Display and Video campaigns, and the engagement rate measured in Google Analytics 4: the share of sessions that last more than 10 seconds, include a key event or view at least two pages, according to the GA4 definition. It shows whether paid visitors interact with the site or leave at once.
Impression share is the most useful visibility metric, because it shows the room left to grow. Google defines it as impressions divided by the estimated number of impressions you were eligible for, based on targeting, approval status and quality (Google Ads Help, About impression share). Read it with its two companions:
Since average position was removed, Google measures placement with the top impression rate (share of impressions among the top ads, usually above the organic results) and the absolute top impression rate (first ad). In its page on top and absolute top metrics, Google notes that these rates are not suited as bid targets, since they can fall when bids rise and more auctions are entered.
The click-through rate measures how well the ad matches the search. A low CTR on a relevant keyword points to weak ad copy or a poor position; a low CTR on a broad keyword points to a targeting problem. You can test scenarios with the CTR calculator.
The cost per click is set by the auction: your bid, your ad quality and competition. Read it next to the conversion rate: a high CPC is acceptable when the click converts well, and a low CPC is useless when it brings the wrong visitors. Search term reports and negative keywords are the usual fix for clicks that never convert, as explained in our guide to paid search.
Every result metric depends on reliable conversion tracking. Duplicate tags, missing values or lost conversions distort CPA and ROAS, and they also mislead Smart Bidding, which optimises on the conversions it sees. Check your setup with our guide to conversion tracking, and recover part of the conversions lost to cookies with enhanced conversions.
| Goal | Main KPI | Diagnostic metrics |
|---|---|---|
| Online sales | ROAS (or profit after ad spend) | Conversion value, conversion rate, CPC, impression share lost to budget |
| Lead generation | CPA, then cost per qualified lead | Conversion rate, CTR, share of leads that become customers |
| Brand protection | Impression share on brand terms | Absolute top impression rate, CPC on brand |
| Awareness (Video, Display) | CPM and reach | Frequency, view rate, branded search volume afterwards |
| App installs | Cost per install, then cost per in-app action | CTR, conversion rate in the store |
Keep one main KPI per campaign and agree on it with whoever pays the bills. A report with 20 KPIs at the same level hides the one that matters.
When the main KPI degrades, read the other metrics in this order to find the cause:
The most cited dataset is the WordStream by LocaliQ Search Advertising Benchmarks report. Its 2026 edition, which analysed thousands of Google Ads and Microsoft Ads campaigns across 20 industries between April 2025 and March 2026, reports these averages, as summarised by Search Engine Journal (checked October 2026):
| Metric | All-industry average, April 2025 - March 2026 |
|---|---|
| Click-through rate | 6.64% |
| Cost per click | $5.42 |
| Conversion rate | 8.18% |
| Cost per lead | $66.69 |
Use these numbers with care: they are averages across very different industries, mostly US campaigns, and legal or home services pay far more per click than restaurants or travel. Your own trend is the better benchmark: compare each month with the same month last year and with the previous period, and judge CPA and ROAS against your margins, not against an average. For the cost side, see our Google Ads cost guide, and run a full Google Ads audit when several metrics degrade at once.
Paid metrics only describe the visits you buy. A complete view also covers organic search and the answers of AI assistants, where people now compare offers before they click any ad:
Sorank, our product, follows the organic and AI side in one place with its GEO and SEO dashboard and its AI mention tracking on ChatGPT, Claude and Gemini.
The right PPC metrics are the ones that explain your main KPI: choose CPA or ROAS according to your goal, read impression share, CTR, CPC and conversion rate as diagnostics, check your conversion tracking first, and compare yourself with your own history before industry averages. Then balance paid spend with organic visibility on Google and in AI answers with Sorank, from $49 per month with a 3-day free trial.

A good ROAS is one above your break-even point, which equals 1 divided by your gross margin. With a 50% margin, break-even is a ROAS of 2, so a campaign at 4 makes money on the first order. Businesses with repeat customers can accept a lower first-order ROAS when lifetime value covers the gap.
CPC is what you pay on average for one click, while CPA is what you pay on average for one conversion, such as a lead or a sale. CPA equals CPC divided by the conversion rate. A campaign can have a high CPC and a good CPA if its clicks convert well.
Check spend, conversions and tracking anomalies every few days, review search terms and CPA or ROAS weekly, and analyse trends, impression share and budget allocation monthly. Avoid changing bids every day: automated bidding needs stable data, and daily figures on small accounts are mostly noise.
 AI Content Brief Generator
 FAQ Schema Generator
 AI Blog Post Ideas Generator
 Structured Data Validator
 Alt Text Checker
 Internal Link Analyzer
 Backlink Challenge
 AI Meta Description Generator
 AI Blog Title Generator
 Google Indexability Checker
 AI Blog Outline Generator
 UTM Link Builder
 Keyword Clustering Tool
 Canonical Tag Checker
 XML Sitemap Generator
 Broken Link Checker
 AI SEO Title Generator
 Headline Analyzer
 SERP Preview Tool
 Redirect Checker
 Hreflang Tag Generator
 Heading Structure Analyzer
 HTTP Headers Checker
 Favicon Extractor
 SERP CTR Calculator
 SEO vs Paid Search Savings Calculator
 SEO Share of Voice Calculator
 SEO ROI Calculator
 SEO Traffic and Revenue Forecast Calculator
 SEO Budget Calculator
 SEO Break-Even Calculator
 SaaS SEO ROI Calculator
 ROAS Calculator
 Reading Time Calculator
 Ranking Gain Simulator
 Organic Traffic Value Calculator
 Organic Traffic Estimator
 LTV to CAC Ratio Calculator
 Local SEO ROI Calculator
 Link Building Cost Calculator
 Keyword Value Calculator
 Keyword Opportunity Score Calculator
 Keyword Density Calculator
 GEO ROI Calculator
 GEO Content Investment Calculator
 Ecommerce SEO ROI Calculator
 Customer Lifetime Value Calculator
 Customer Acquisition Cost Calculator
 CTR Calculator
 Cost Per Article Calculator
 Conversion Rate Calculator
 Content Marketing ROI Calculator
 ChatGPT Referral Traffic Estimator
 Bounce Rate Calculator
 Backlink ROI Calculator
 AI Visibility Score Calculator
 AI Traffic Value Calculator
 AI Share of Voice Calculator
 Cost of AI Invisibility Calculator
 AI Citation Rate Calculator
 llms.txt Validator
 AI Overview Checker
 Robots.txt Checker
 AI SEO Audit
 LLM Readability Checker
 SearchGPT Readiness Checker
 Structured Data LLM Audit
 Website Crawlability AI Audit
 Why ChatGPT Is Not Recommending My Website
 Gemini Ranking Tool
 Perplexity Ranking Checker
 LLM Citation Checker
 Answer Engine Optimization Audit
 GEO Audit
 AI Search Visibility Test
 ChatGPT Visibility Checker
 llms.txt Generator
 URL Extractor
 Webpage to Markdown
 Sitemap Checker
 SERP Volatility Sensor
 Page Size Checker
 Word Counter
 Slug Generator
 Schema Generator
 Robots Generator
 OG Preview
 Meta Tags Generator
 Image Compressor
 Favicon Generator
 On-Page SEO Audit
 Backlink Analysis Tool
 Keyword Research Tool
 Domain Authority Checker
THEY TRIED SORANK BEFORE YOU
 “I tested Sorank on a real client site and it's insane. It does everything an agency would bill you $1500 a month for. It's going into production on that client now.”

 Guillaume Guersanguersanguillaume.com“We are an Ads agency and we wanted to get our SEO back on track once and for all. Sorank gave us a clear view of our site, helped us prioritize optimizations, and properly structure our content. The tool is easy to use, well designed for a team, and very practical for centralizing tracking without having to juggle multiple platforms. A very solid foundation to start fresh with our SEO.”
 Gaspard MadouiAds Agency
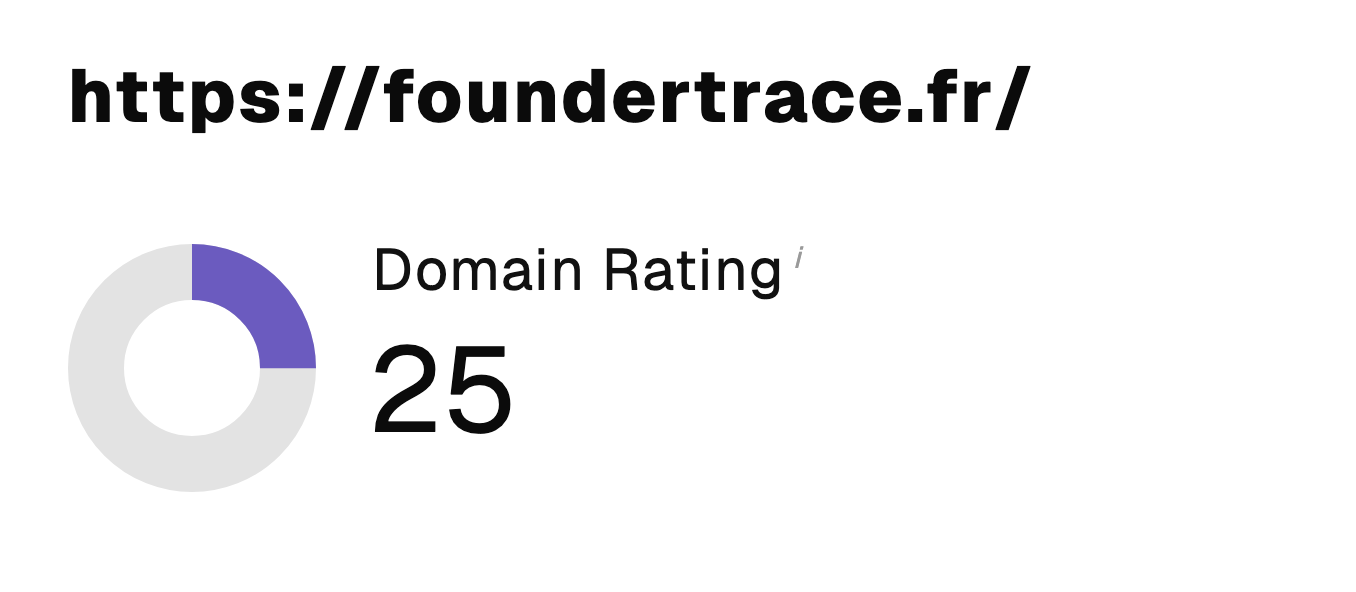 “I just let the Sorank software do its thing, and now my DR is 25 and my page is ranking higher.”
 Lucas Flandrefoundertrace.fr“I specialized in GEO thanks to Sorank. The GEO Leaderboard allows me to show my clients their position vs competitors on ChatGPT. It’s a real commercial differentiator.”
 MélanieSEO Freelance“Great service, works well for our website and helps us understand how to improve it to rank better on Google and elsewhere. Congrats, keep going, I recommend it.”
 Hugo T.E-commerce merchant