Preferences
Privacy is important to us, so you have the option of disabling certain types of storage that may not be necessary for the basic functioning of the website. Blocking categories may impact your experience on the website. More information

Privacy is important to us, so you have the option of disabling certain types of storage that may not be necessary for the basic functioning of the website. Blocking categories may impact your experience on the website. More information

SEO benchmarks explained: sourced figures for CTR by position, time to rank and AI Overviews, plus a 7-step method to benchmark your site against competitors.
Tools


In short
an SEO benchmark is a reference point used to judge your search performance. It has two meanings: comparing your site with the competitors that rank on your keywords, and comparing your metrics with published reference figures (click-through rate by position, time to rank, effect of AI Overviews). A useful benchmark combines both with your own historical baseline from Google Search Console, then turns the gaps into a prioritised action list.
Want to go further? Ask
A number means little without a point of comparison. A 3% click-through rate is weak for a page in position 1 and excellent for a page in position 8, and 2,000 monthly clicks can be a success or a failure depending on what competitors get. Every figure below comes with its source and date, because SEO benchmarks age fast: the arrival of AI summaries in Google results has already moved the click curves measured a few years ago. Definitions follow the Search Console Performance report, where CTR is clicks divided by impressions and average position uses the topmost position your site occupies for each query.
An SEO benchmark answers the question "is this result good?" by setting it against a reference. Three references exist, and a solid benchmark uses all three:
A benchmark is different from a KPI. A KPI is the metric you decide to move (non-branded clicks, leads from organic search); the benchmark is the reference that tells you whether its level is good. Our guide to SEO KPIs covers which metrics to track; this article covers what to compare them with.
Most figures circulating online are copied from one study to the next without a date. The table below keeps only figures whose source has been opened and checked, with their scope. For a broader collection, see our page of SEO statistics.
| Indicator | Reference figure | Source and scope |
|---|---|---|
| CTR of the first organic result | 27.6% on average | Backlinko, analysis of about 4 million Google results (page updated April 2025) |
| Position 1 versus position 10 | About 10 times more clicks | Backlinko, same study |
| Gain from moving up one position | +2.8 points of CTR on average | Backlinko, same study |
| Clicks when an AI summary appears | 8% of visits with a click on a classic result, against 15% without summary | Pew Research Center, US browsing data, March 2025 |
| Organic CTR on informational queries with AI Overviews | From 1.76% to 0.61% between June 2024 and September 2025 | Seer Interactive, 3,119 queries from 42 organisations |
| Brands cited in AI Overviews | 35% higher organic CTR than brands not cited | Seer Interactive, Q3 2025 (correlation, not proven causation) |
| New pages reaching the top 10 within a year | 1.74% (6.11% in a second sample) | Ahrefs, study published May 2025 |
| Age of the page ranking first | 5 years on average (2 years in 2017) | Ahrefs, same study |
Three lessons stand out. First, the Backlinko CTR study shows a steep click curve, so moving from position 4 to position 2 is often worth more than adding new keywords in position 15: estimate the gain with the SERP CTR calculator. Second, the Seer Interactive study on AI Overviews shows that the same position now earns fewer clicks on informational queries, so a CTR benchmark from 2022 overestimates what you should expect today. Third, the Ahrefs study on time to rank confirms that rankings are built over months and years; our article on how long SEO takes details realistic timelines.
A competitive benchmark compares your site with a small set of rivals on the same indicators, at the same date. Seven steps are enough.
Pick 3 to 5 search competitors: the sites that rank on your target keywords, which are often media, marketplaces or niche blogs rather than your business rivals. Add one aspirational site you want to catch up with.
Group 50 to 300 keywords by topic and by intent (informational, commercial, transactional), and keep this list unchanged between two benchmarks. Separate branded queries, which say little about SEO strength.
For each site, record positions on the keyword set, then compute a visibility score weighted by search volume and CTR. Share of voice expresses it as a percentage of the total visibility of the group. The SEO share of voice calculator does the computation from your positions and volumes.
For the most valuable keywords, look at the type of page that ranks (guide, list, category page, tool), its depth, its freshness and the SERP features present. A SERP analysis shows what Google rewards, and a competitive content analysis shows where competitor content is stronger than yours.
List the keywords where competitors rank and you do not. A keyword gap analysis turns this list into a content plan. Sorank's SEO Competitor Spy automates the watch on up to 5 competitors and sends the keywords behind their new pages to your content calendar every week.
Count referring domains, compare the quality of linking sites and check the basics: indexing, page speed, mobile usability and internal linking. A strong content gap is often explained by an authority gap.
Rank each gap by expected impact (traffic or revenue at stake) and effort. The output of a benchmark is a short list of actions with owners and dates, not a 40-page report.
| Dimension | Metric to compare | Where to get it |
|---|---|---|
| Visibility | Positions, visibility score, share of voice | Rank tracker, SEO suite |
| Traffic | Estimated organic clicks, top pages | SEO suite for competitors, Search Console for you |
| Content | Pages per topic, format, freshness, depth | Manual review, crawler |
| Keywords | Keywords ranked by competitors and not by you | Keyword gap report |
| Authority | Referring domains, quality of linking sites | Backlink tool |
| Technical | Indexed pages, Core Web Vitals, errors | Search Console, PageSpeed Insights, crawler |
| AI visibility | Mention rate and citations in AI answers | Prompt panel, AI tracking software |
Your history is the benchmark you can trust most. Build it in Google Search Console with four rules:
Record the baseline once (clicks, impressions, CTR, average position, conversions from organic) and update it monthly. A dashboard such as Sorank's GEO / SEO dashboard keeps Search Console, Google Analytics and AI visibility in one view, which makes month-on-month comparison faster.
Classic benchmarks stop at Google results, while part of the research now happens in ChatGPT, Gemini, Perplexity and AI Overviews. The Pew Research Center found that users click a classic result almost half as often when a summary appears. Being named in the answer becomes a performance indicator in its own right.
Benchmark it like rankings: a fixed panel of 30 to 100 prompts your buyers ask, the same assistants, the same competitors, measured every month. Three metrics are enough: mention rate (share of answers that name you), AI share of voice (your mentions against those of competitors) and citations (how often your pages are used as sources). Our study of the platforms AI assistants cite most helps you see which third-party sites weigh in your market, and the GEO Leaderboard ranks the sites assistants cite in your market every week, with your own rank among them.
A good SEO benchmark compares you with your own history, with the competitors that rank on your keywords and with dated reference figures, then ends with a short list of priorities. Keep the method fixed, separate brand from non-brand, read CTR against the position curve, and add AI visibility to the comparison. To automate the competitor watch and turn their new keywords into articles, compare the Sorank plans (3-day free trial), with first effects on Google usually visible within 2 to 4 months.

It depends on position, query type and SERP layout. Backlinko measured an average CTR of 27.6% for the first organic result, with a steep drop after the top three. Informational queries that trigger an AI summary get far fewer clicks, so compare each page with pages of the same type and position on your own site.
Track your own baseline monthly in Google Search Console and run a full competitive benchmark every quarter or every six months. Monthly AI visibility checks with a fixed prompt panel complete the picture. Measuring too often adds noise, since rankings fluctuate daily.
An SEO audit checks your own site for problems: indexing, technical errors, content, links. A benchmark compares your results with references: your past, your competitors and industry figures. The audit tells you what is broken, the benchmark tells you where you stand and which gaps matter most.
 AI Content Brief Generator
 FAQ Schema Generator
 AI Blog Post Ideas Generator
 Structured Data Validator
 Alt Text Checker
 Internal Link Analyzer
 Backlink Challenge
 AI Meta Description Generator
 AI Blog Title Generator
 Google Indexability Checker
 AI Blog Outline Generator
 UTM Link Builder
 Keyword Clustering Tool
 Canonical Tag Checker
 XML Sitemap Generator
 Broken Link Checker
 AI SEO Title Generator
 Headline Analyzer
 SERP Preview Tool
 Redirect Checker
 Hreflang Tag Generator
 Heading Structure Analyzer
 HTTP Headers Checker
 Favicon Extractor
 SERP CTR Calculator
 SEO vs Paid Search Savings Calculator
 SEO Share of Voice Calculator
 SEO ROI Calculator
 SEO Traffic and Revenue Forecast Calculator
 SEO Budget Calculator
 SEO Break-Even Calculator
 SaaS SEO ROI Calculator
 ROAS Calculator
 Reading Time Calculator
 Ranking Gain Simulator
 Organic Traffic Value Calculator
 Organic Traffic Estimator
 LTV to CAC Ratio Calculator
 Local SEO ROI Calculator
 Link Building Cost Calculator
 Keyword Value Calculator
 Keyword Opportunity Score Calculator
 Keyword Density Calculator
 GEO ROI Calculator
 GEO Content Investment Calculator
 Ecommerce SEO ROI Calculator
 Customer Lifetime Value Calculator
 Customer Acquisition Cost Calculator
 CTR Calculator
 Cost Per Article Calculator
 Conversion Rate Calculator
 Content Marketing ROI Calculator
 ChatGPT Referral Traffic Estimator
 Bounce Rate Calculator
 Backlink ROI Calculator
 AI Visibility Score Calculator
 AI Traffic Value Calculator
 AI Share of Voice Calculator
 Cost of AI Invisibility Calculator
 AI Citation Rate Calculator
 llms.txt Validator
 AI Overview Checker
 Robots.txt Checker
 AI SEO Audit
 LLM Readability Checker
 SearchGPT Readiness Checker
 Structured Data LLM Audit
 Website Crawlability AI Audit
 Why ChatGPT Is Not Recommending My Website
 Gemini Ranking Tool
 Perplexity Ranking Checker
 LLM Citation Checker
 Answer Engine Optimization Audit
 GEO Audit
 AI Search Visibility Test
 ChatGPT Visibility Checker
 llms.txt Generator
 URL Extractor
 Webpage to Markdown
 Sitemap Checker
 SERP Volatility Sensor
 Page Size Checker
 Word Counter
 Slug Generator
 Schema Generator
 Robots Generator
 OG Preview
 Meta Tags Generator
 Image Compressor
 Favicon Generator
 On-Page SEO Audit
 Backlink Analysis Tool
 Keyword Research Tool
 Domain Authority Checker
THEY TRIED SORANK BEFORE YOU
 “I tested Sorank on a real client site and it's insane. It does everything an agency would bill you $1500 a month for. It's going into production on that client now.”

 Guillaume Guersanguersanguillaume.com“We are an Ads agency and we wanted to get our SEO back on track once and for all. Sorank gave us a clear view of our site, helped us prioritize optimizations, and properly structure our content. The tool is easy to use, well designed for a team, and very practical for centralizing tracking without having to juggle multiple platforms. A very solid foundation to start fresh with our SEO.”
 Gaspard MadouiAds Agency
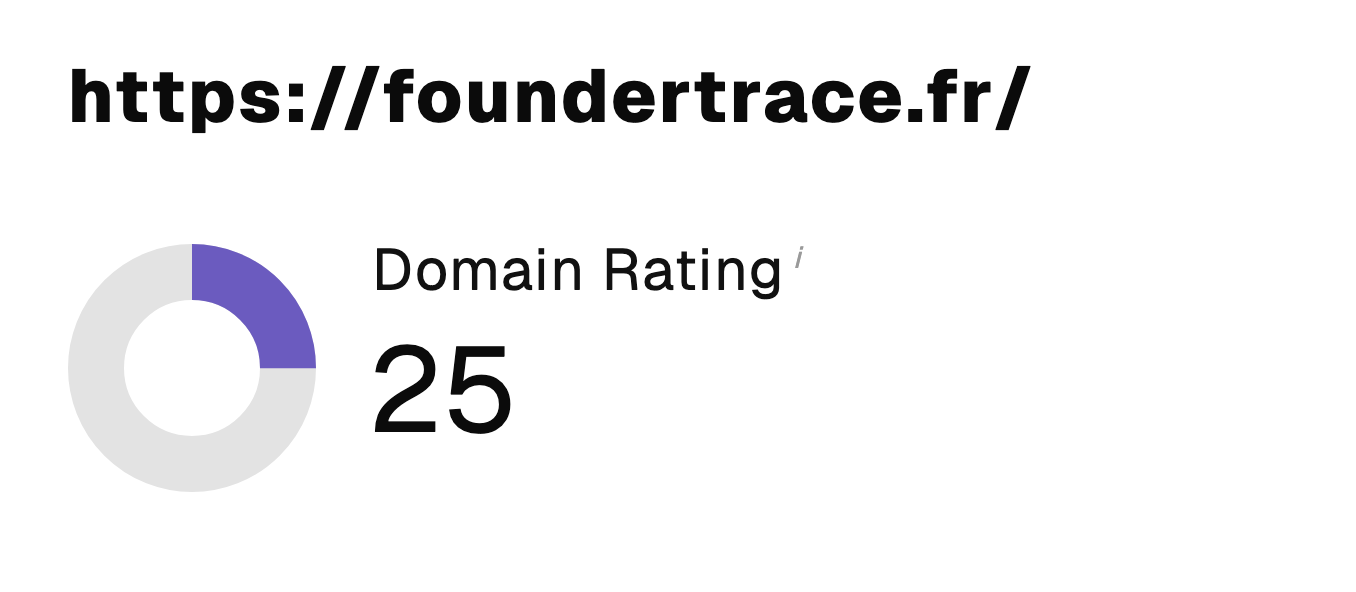 “I just let the Sorank software do its thing, and now my DR is 25 and my page is ranking higher.”
 Lucas Flandrefoundertrace.fr“I specialized in GEO thanks to Sorank. The GEO Leaderboard allows me to show my clients their position vs competitors on ChatGPT. It’s a real commercial differentiator.”
 MélanieSEO Freelance“Great service, works well for our website and helps us understand how to improve it to rank better on Google and elsewhere. Congrats, keep going, I recommend it.”
 Hugo T.E-commerce merchant