Preferences
Privacy is important to us, so you have the option of disabling certain types of storage that may not be necessary for the basic functioning of the website. Blocking categories may impact your experience on the website. More information
Privacy is important to us, so you have the option of disabling certain types of storage that may not be necessary for the basic functioning of the website. Blocking categories may impact your experience on the website. More information

 Google Analytics Dimensions: What They Are and How to Use Them in GA4
What Google Analytics dimensions are in GA4, which ones to use, their API names, the limits per property and how to create a custom dimension step by step.


In short
A Google Analytics dimension is a text attribute that describes your data, such as the country of a visitor, the device they used or the page where their session started. Dimensions give context to metrics like sessions or conversions. Start with the built-in dimensions, and create a custom dimension only when that list cannot answer your question, within your property's limits (50 event-scoped and 25 user-scoped on a standard property).
Want to go further? Ask
Quick quiz
Which way of measuring your marketing fits you?
Sorank matches your answers


Test it for 3 days on your own site and see where you stand on Google, ChatGPT and the other AIs.
Start 3-day free trial3 days free, then stop whenever you want. 90-day results guarantee, conditions apply.
Every number in a GA4 report has a label. The number is a metric. The label is a dimension. "412 sessions" is a metric. "412 sessions from Germany on mobile" adds two dimensions, country and device category, that tell you which visitors produced that number.
Google's Analytics Help reference uses the same split. Dimensions are descriptive attributes, and they are text or categories. Metrics are quantities. Averages, rates and percentages count as metrics, even when they are calculated from other metrics. You can add up sessions across rows. You cannot add up countries. You group by them.
This is why the same metric can mean different things. An engagement rate of 60% on a landing page reads very differently once you know the visitors came from your newsletter and not from a paid campaign. The dimension tells you who arrived. The metric tells you how many of them did something.
If GA4 itself is new to you, read our GA4 glossary entry first, then come back here. This guide assumes that data already flows into a GA4 property.
Dimension or metric?
Older guides describe "custom dimension index 1" and hit-level scopes. That world is over. Google stopped processing new hits for standard Universal Analytics properties on July 1, 2023. The 360 properties that had a current order got extra processing time until July 1, 2024. If your team still talks in index numbers, translate that habit. In GA4 you give each custom dimension a name, and you point it to a parameter that your site or app sends.
Universal Analytics end dates
Source: Google Analytics Help, "Google Analytics 4 has replaced Universal Analytics"
Google's Analytics Help page on dimensions and metrics groups the built-in dimensions into 16 categories: Attribution, Demographics, Ecommerce, Event, Gaming, General, Geography, Link, Page / screen, Platform / device, Publisher, Time, Traffic source, User, User lifetime and Video. The same page also lists 11 metric categories, such as Session, Revenue and Advertising. Keep the two lists apart when you search, because a metric category will not help you filter by country.
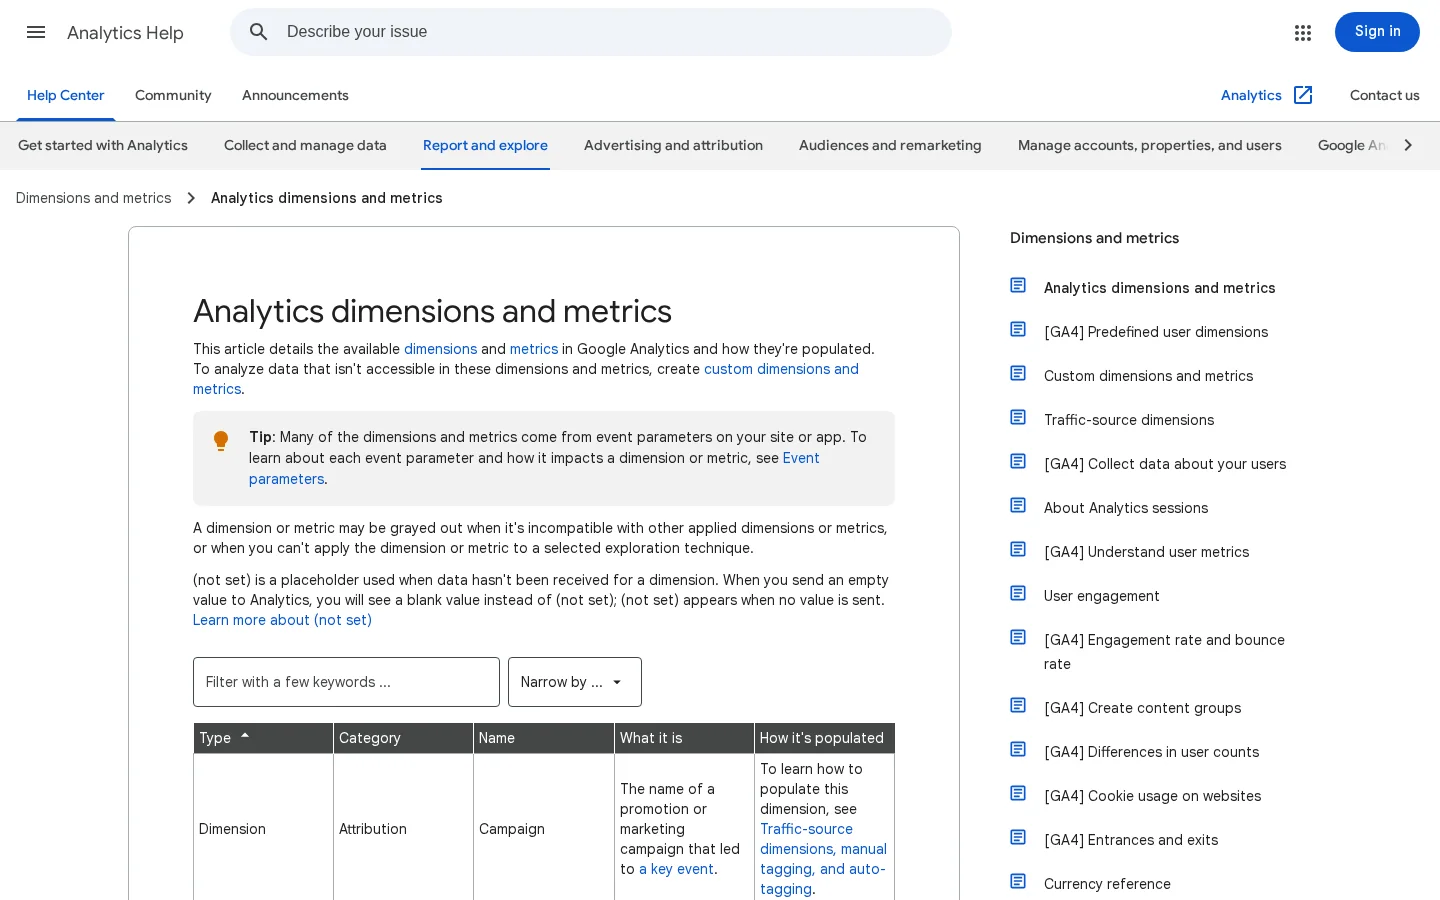
You do not need to memorize the list. You need to know which category holds the answer to your question. Four categories cover most of the work on a content site:
Event and User dimensions come next. Event dimensions describe an action, such as a button click or a video play. User dimensions describe the visitor across sessions, such as the source that first brought them to your site. Knowing this split tells you whether a question belongs to a session, an event or a user. Mixing those levels is one of the most common reasons a report looks wrong, and we come back to it in the mistakes section.

Each dimension has two names. The UI name is what you see in a report. The API name is what you send to the Google Analytics Data API, and you need it for exports, scripts and dashboards. Google documents the API names in its Data API schema. The table below covers the dimensions most content sites use.
| UI name | API name | Answers the question |
|---|---|---|
| Session source | sessionSource | Which site or platform started the session |
| Session medium | sessionMedium | Which type of traffic it was, such as organic, referral or cpc |
| Session default channel group | sessionDefaultChannelGroup | Which channel group the session belongs to |
| Landing page | landingPage | The first page of the session |
| Page path | pagePath | The path part of each page the visitor opened |
| Country | country | Where the user activity came from |
| Device category | deviceCategory | Desktop, tablet or mobile |
| Event name | eventName | Which event was recorded |
| Date | date | The event date, formatted as YYYYMMDD |
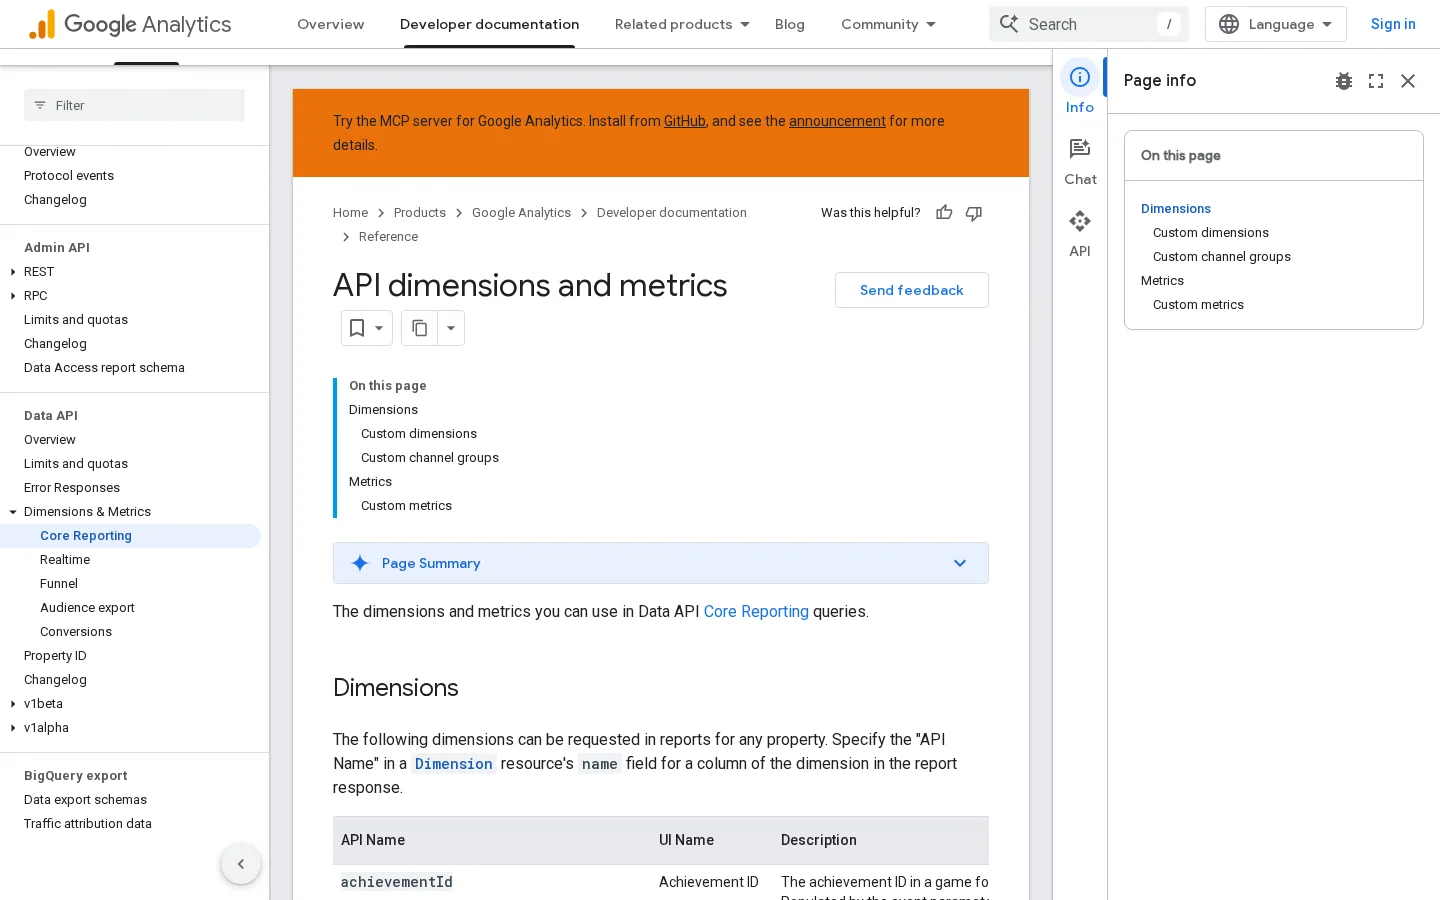
Three rules help when you move between the interface and the API. First, API names are case-sensitive, so sessionSource is not SessionSource. Second, each extra dimension splits every row into more rows, which makes the output harder to read, so start with two or three. Third, a request that names a dimension your property does not know will fail. That last point matters most for custom dimensions.
Custom dimensions use a different pattern. Google's schema references them by scope and parameter name. An event-scoped dimension is written as customEvent: followed by the parameter name. A user-scoped dimension is written as customUser: followed by its parameter name. The example below asks for session source and an event-scoped custom dimension called author_name, over the last 28 days. Replace the names with your own.
{
  "dimensions": [
    { "name": "sessionSource" },
    { "name": "customEvent:author_name" }
  ],
  "metrics": [{ "name": "sessions" }],
  "dateRanges": [{ "startDate": "28daysAgo", "endDate": "yesterday" }]
}
This request works only if your property has registered author_name as an event-scoped custom dimension. Otherwise the request fails. Register first, then query.
Note
Dimensions registered before October 2020 use a longer form that includes the event name in brackets, such as customEvent:parameter_name[event_name]. If a query that worked last year fails now, check whether the dimension is one of these legacy ones.
A primary dimension is the one a report is grouped by. Each row is one value of that dimension. A secondary dimension adds a second breakdown inside each row. The idea is simple, but it is where most people get stuck, because the same data answers a different question depending on which dimension comes first.
| Question | Primary dimension | Secondary dimension | What you learn |
|---|---|---|---|
| Which pages get organic visits? | Landing page | Session source / medium | Whether search is the main source for each page, or whether the page depends on other channels |
| Are visitors from a market mostly on phones? | Country | Device category | The mobile share for each country, which tells you where to test layouts first |
| Which campaigns land on which pages? | Session campaign | Landing page | Campaigns sent to pages that do not match their offer |
| Which browsers do visitors from one country use? | Browser | Country | Compatibility problems that only appear in one market |
You can stack more than two dimensions in an Explorations table, but readability drops fast. Keep to two or three in one view, and move the rest into filters. A filter removes rows, and a dimension splits them. Use filters to narrow the question, and dimensions to explain the answer.
Take the first row of the table above. If Landing page is primary and Session source is secondary, each row is a page with its traffic split by source. Flip them, and each row is a source with its pages listed underneath. The numbers are identical. The question is different. Decide which one you need before you open the report, and write it down in one sentence.
Standard dimensions cover most reporting. You need a custom dimension when the information lives in your own system, or in a parameter you send yourself. Typical cases are an author name on a blog, a plan type in a SaaS app, a content category, or whether the visitor was logged in. Before you create anything, ask one question: could the built-in list answer this? If yes, stop there.
The scope decides what a custom dimension describes. An event-scoped dimension attaches to one event, such as a click or a page view that carries a parameter. A user-scoped dimension attaches to a visitor and keeps the same value across their sessions, such as a plan tier. An item-scoped dimension attaches to one item inside an ecommerce event, such as the colour of a product.
| Scope | Attaches to | Typical use | Standard property | 360 property |
|---|---|---|---|---|
| Event-scoped | One event | Author of the article that was read | 50 | 125 |
| User-scoped | One visitor | Plan tier, logged-in status | 25 | 100 |
| Item-scoped | One item in an ecommerce event | Product brand or colour | 10 | 25 |
Custom dimension limits on a standard property
Source: Google Analytics Help, custom dimensions and metrics overview
The limits apply per property, and they count every registered dimension. The Custom definitions page in Admin shows your usage. Open the Quota information link at the top right to see how many slots you have left. Keep that page open whenever you plan a tracking change.
If you reach the limit, freeing a slot is not instant. Google's help page on custom dimension limits says you must wait 48 hours after deleting dimensions before you can add new ones. Plan your names before you start, and avoid creating a dimension for a one-off test that you will delete next week.
Warning
Never send personal data as a dimension value. Names, email addresses and phone numbers are personally identifiable information, and Google's rules forbid sending them to Analytics. An author name is fine. A customer's email address is not, even if it is hashed in your code.
These steps assume that your site or app already sends the parameter. If no data arrives, the dimension is created but it shows nothing. Work through the list in order.
Create a custom dimension in five steps
Source: Google Analytics Help, "[GA4] About custom dimensions and metrics"
Open DebugView, then trigger the event on your site or in your app. Look at the event and its parameters. Confirm that the value is the one you expect, for example "Jane Doe" for an author and not "undefined". Only then create the dimension. A parameter that sends the wrong value will fill your reports with wrong data from that day on, and the earlier days cannot be corrected.
The parameter name in the interface must match the name your code sends. A one-letter difference, an uppercase letter or a space creates a dimension that never fills. Copy the name from your code instead of typing it from memory. Use lowercase letters and underscores, as in author_name, because you will paste the same string into API requests later.
Note
Google's help page on GA4 custom dimensions says reporting starts 24 to 48 hours after you create a dimension. Do not create a dimension on the afternoon of a campaign launch and expect the data the same day. Create it a few days early, then check it.
Once dimensions exist, you can read them in four places. Each one suits a different job. Choosing the wrong tool costs you time, so compare them before you build anything.
| Method | Best for | Main limit | Example |
|---|---|---|---|
| Standard reports | Quick checks on traffic, pages and events | Fixed layouts with one primary and one secondary dimension | Traffic acquisition by session source |
| Explorations | Custom tables, funnels and path analysis | Takes setup, and large tables get slow | Landing page by session source and device category |
| Data API | Exports, scripts and your own dashboards | Needs code, and every dimension must be registered | Weekly export of sessions by page to a spreadsheet |
| Looker Studio | Shared reports for clients or managers | Depends on the connector and its refresh schedule | Monthly client dashboard with traffic by channel |
Standard reports answer the first question you have each morning. Use them to spot a drop, then move to a more flexible tool to find the cause. Their advantage is speed. Their weakness is that you cannot choose any dimension pair you like, so a question that needs three dimensions will not fit in a standard report.
Explorations let you build a table with the dimensions and metrics you choose, and you can save it for later. This is the tool for landing page analysis, for comparing channels inside one country, and for checking whether a custom dimension really fills. Keep each exploration to one question. A table that answers five questions usually answers none of them clearly.
Tip
Clean dimensions start with clean campaign links. Source and medium values come from your UTM parameters, so a spelling difference such as "Newsletter" and "newsletter" creates a second row for the same channel. Build your links with our free UTM Link Builder so the names stay consistent.
Use the API when a report runs every week, when you feed a dashboard, or when you want to compare the output of two properties in a script. The request pattern shown earlier in this guide is the building block. Once it works in a test, put the same JSON in your script, and keep the dimension names in one place, so a rename does not break ten queries at once.
Looker Studio is the usual choice when someone else needs to read the numbers. It connects to GA4 and presents the dimensions as charts and tables. Its limits come from the connector and its refresh schedule, not from GA4 itself. If you are building a client dashboard, our guide to Looker Studio for SEO covers the formulas and limits that matter for search data, and our guide to a GA4 dashboard covers what to put on the first screen.
AI assistants send visitors who arrive through a link, and that link carries a referral source. You can see this in the session source dimension and in the landing page. Some AI apps do not pass a referrer at all, so this method captures only part of the picture. Our glossary entry on AI dark traffic explains what is missing and why. For organic search in the same report, our guide to Google Analytics for SEO shows how to separate it from the rest.
Isolate AI visits in four steps
Read the result with care. A rise in AI sessions on one page tells you that the page is being used, but it does not tell you whether the visitors bought anything. Add a conversion metric to the table before you decide that a page works. The article on measuring AI citations with Google Analytics walks through the conversion side.
Tip
If you want Google and AI traffic on one screen without building the exploration yourself, Sorank's GEO / SEO dashboard shows both, combining Google Search Console data (clicks, impressions, CTR, position) with the page views that AI assistants send, as recorded in Google Analytics.
Most dimension problems show up as an empty column, a column of "(not set)" values, or a report that looks correct but answers the wrong question. The table gives you the sign to look for. The sections below explain each mistake.
| Mistake | How to spot it | Fix |
|---|---|---|
| Creating a dimension before data arrives | Every row shows "(not set)" | Confirm the value in DebugView first, then create the dimension |
| Name mismatch between code and interface | No data 48 hours later | Copy the parameter name from the code |
| Duplicating a built-in dimension | Two dimensions give the same rows | Review the standard list first, then delete the copy |
| High-cardinality values | Thousands of rows, each with one session | Send categories, and keep unique IDs in your own system |
| Personal data in a value | Values that look like emails or full names | Remove the parameter and send a category instead |
| Expecting history | Old dates are empty, new dates are filled | Compare only from the creation date onward, and note the gap |
The mistake: you create the dimension, then find that the parameter never reached GA4. You can spot it because every row in the report shows "(not set)". The fix is to reverse the order. Confirm the value in DebugView, then register the dimension, then wait for the 24 to 48 hours that Google describes before you judge the report.
The mistake: the code sends author_name, and the interface holds Author_name or author name. The dimension exists, and it stays empty. The sign is a clean custom definition with zero data after two days. The fix is to open the code, copy the exact string, and check it again in DebugView. Fixing it later does not restore the lost days, so fix it the day you find it.
The mistake: you create a custom dimension called Country, because you did not check the standard list. You can see it in two rows that carry the same values. The cost is quota. Every duplicate uses one of your 50 event-scoped slots, or one of your 25 user-scoped slots, and those slots are the ones you need later for things GA4 cannot give you. Review the standard list in the reports first, then decide.
The mistake: you send a dimension with a value that is unique to each visitor or each order, such as a user ID, a full URL with a query string, or an order number. Google advises avoiding high-cardinality dimensions in standard properties. The sign is a table with thousands of rows, each one holding a single session. The fix is to send a category instead. Send plan type, not user ID. Send content type, not the full URL. Keep the unique identifier in your CRM, where you can join it back to the data yourself.
The mistake: a dimension holds an email address, a name or a phone number, often because a developer used a convenient variable. The sign is a value that looks like a person. The fix is to remove the parameter, and to send a category or an anonymous internal code. Check this with your data protection contact if you are unsure. Hashing an email address does not make it safe to send.
The mistake: you create a dimension in May and expect it to explain the sessions from January. Reports can only show values that were collected after the dimension started to receive them. The sign is an empty column for the earlier dates. The fix is to state the start date in the report title, and to compare only from that date onward. Do not present a before and after chart that starts in the middle of a gap.
A dimension is a text attribute, such as country, device or page path. A metric is a number, such as sessions, active users or conversions. Dimensions group and label the numbers, so the same metric reads differently depending on the dimensions you pair with it.
A standard property allows 50 event-scoped, 25 user-scoped and 10 item-scoped custom dimensions. A 360 property allows 125, 100 and 25. The Custom definitions page in Admin shows how many you have used. Deleting one does not free its slot instantly, because you must wait 48 hours before you can add a new one.
Usually the parameter does not reach GA4, or its name does not match exactly. Check DebugView, fix the name in the interface or in your code, and wait 24 to 48 hours after creation. If the data still does not appear, the parameter itself is probably not being sent.
Your checklist for this week
Start with one question you cannot answer today. Build one dimension for it, check the data, and only then add the next one.
A dimension is a text attribute, such as country, device or page path. A metric is a number, such as sessions, active users or conversions. Dimensions group and label the numbers.
A standard property allows 50 event-scoped, 25 user-scoped and 10 item-scoped custom dimensions. A 360 property allows 125, 100 and 25. The Custom definitions page in Admin shows your usage.
Usually the parameter does not reach GA4, or its name does not match exactly. Check DebugView, fix the name, and wait 24 to 48 hours after creation before you judge the report.
We analyse your competitors, your website and your AI visibility to create a tailored content plan for free.
 AI Content Brief Generator
 FAQ Schema Generator
 AI Blog Post Ideas Generator
 Structured Data Validator (Schema Validator)
 Alt Text Checker
 Internal Link Analyzer
 Backlink Challenge
 AI Meta Description Generator
 AI Blog Title Generator
 Google Indexability Checker
 AI Blog Outline Generator
 UTM Link Builder
 Keyword Clustering Tool
 Canonical Tag Checker
 XML Sitemap Generator
 Broken Link Checker
 AI SEO Title Generator
 Headline Analyzer
 SERP Preview Tool
 Redirect Checker
 Hreflang Tag Generator
 Heading Structure Analyzer
 HTTP Headers Checker
 Favicon Extractor
 SERP CTR Calculator
 SEO vs Paid Search Savings Calculator
 SEO Share of Voice Calculator
 SEO ROI Calculator
 SEO Traffic and Revenue Forecast Calculator
 SEO Budget Calculator
 SEO Break-Even Calculator
 SaaS SEO ROI Calculator
 ROAS Calculator
 Reading Time Calculator
 Ranking Gain Simulator
 Organic Traffic Value Calculator
 Organic Traffic Estimator and Website Traffic Checker
 LTV to CAC Ratio Calculator
 Local SEO ROI Calculator
 Link Building Cost Calculator
 Keyword Value Calculator
 Keyword Opportunity Score Calculator
 Keyword Density Calculator
 GEO ROI Calculator
 GEO Content Investment Calculator
 Ecommerce SEO ROI Calculator
 Customer Lifetime Value Calculator
 Customer Acquisition Cost Calculator
 CTR Calculator
 Cost Per Article Calculator
 Conversion Rate Calculator
 Content Marketing ROI Calculator
 ChatGPT Referral Traffic Estimator
 Bounce Rate Calculator
 Backlink ROI Calculator
 AI Visibility Score Calculator
 AI Traffic Value Calculator
 AI Share of Voice Calculator
 Cost of AI Invisibility Calculator
 AI Citation Rate Calculator
 llms.txt Validator
 AI Overview Checker and AI Overviews Rank Checker
 Robots.txt Checker
 AI SEO Audit
 LLM Readability Checker
 SearchGPT Readiness Checker
 Structured Data LLM Audit
 Website Crawlability AI Audit
 Why ChatGPT Is Not Recommending My Website
 Gemini Ranking Tool
 Perplexity Ranking Checker
 LLM Citation Checker
 Answer Engine Optimization Audit
 GEO Audit
 AI Search Visibility Test
 ChatGPT Visibility Checker
 llms.txt Generator
 URL Extractor
 Webpage to Markdown
 Sitemap Checker
 SERP Volatility Sensor
 Page Size Checker
 Word Counter
 Slug Generator
 Schema Generator
 Robots Generator
 OG Preview
 Meta Tags Generator
 Image Compressor
 Favicon Generator
 On-Page SEO Audit: SEO Checker and SEO Analyzer
 Backlink Analysis Tool
 Keyword Research Tool
 Domain Authority Checker
 “I tested Sorank on a real client site and it's insane. It does everything an agency would bill you $1500 a month for. It's going into production on that client now.”

 Guillaume Guersanguersanguillaume.com“We are an Ads agency and we wanted to get our SEO back on track once and for all. Sorank gave us a clear view of our site, helped us prioritize optimizations, and properly structure our content. The tool is easy to use, well designed for a team, and very practical for centralizing tracking without having to juggle multiple platforms. A very solid foundation to start fresh with our SEO.”
 Gaspard MadouiAds Agency
 “I just let the Sorank software do its thing, and now my DR is 25 and my page is ranking higher.”
 Lucas Flandrefoundertrace.fr“I specialized in GEO thanks to Sorank. The GEO Leaderboard allows me to show my clients their position vs competitors on ChatGPT. It’s a real commercial differentiator.”
 MélanieSEO Freelance“Great service, works well for our website and helps us understand how to improve it to rank better on Google and elsewhere. Congrats, keep going, I recommend it.”
 Hugo T.E-commerce merchant