
Preferences
Privacy is important to us, so you have the option of disabling certain types of storage that may not be necessary for the basic functioning of the website. Blocking categories may impact your experience on the website. More information

Privacy is important to us, so you have the option of disabling certain types of storage that may not be necessary for the basic functioning of the website. Blocking categories may impact your experience on the website. More information

Verified ecommerce statistics for 2026: US and French market size, mobile share, cart abandonment, AI shopping traffic, each figure with its dated source.

Tools


In short
online sales keep growing faster than retail as a whole. In the United States, ecommerce reached $340.2 billion in the second quarter of 2026, or 17.1% of all retail sales (US Census Bureau). In France, online sales reached €196.4 billion in 2025, up 7% (Fevad). Smartphones now carry the majority of online transactions (56.4% during the 2025 US holiday season, Adobe), about 70% of shopping carts are abandoned (Baymard Institute), and traffic sent to retail sites by generative AI tools rose by 693.4% in one year (Adobe). Every figure below comes with its source and date.
Want to go further? Ask
Most lists of ecommerce statistics recycle numbers whose origin nobody can trace. This page does the opposite: it keeps only figures published by official statistics agencies, trade federations and research institutes, opened and checked in October 2026. When a figure is an estimate or a survey, we say so. Use it to size a market, build a business case or write content that AI assistants can quote safely.
| Indicator | Figure | Scope and date | Source |
|---|---|---|---|
| US retail ecommerce sales | $340.2 billion | Q2 2026, seasonally adjusted | US Census Bureau |
| Ecommerce share of US retail | 17.1% | Q2 2026 | US Census Bureau |
| French online sales (products and services) | €196.4 billion, up 7% | Year 2025 | Fevad |
| Internet users who bought online in the EU | 77% | Year 2024, people aged 16 to 74 | Eurostat |
| US holiday online spending | $257.8 billion, up 6.8% | Nov. 1 to Dec. 31, 2025 | Adobe Analytics |
| Mobile share of online transactions | 56.4% | US holiday season 2025 | Adobe Analytics |
| Average cart abandonment rate | 70.22% | Average of 50 studies, updated September 2025 | Baymard Institute |
| Growth of traffic from generative AI to retail sites | +693.4% | US holiday season 2025 vs 2024 | Adobe Analytics |
The US Census Bureau quarterly ecommerce report is the reference series for the American market. Its figures for the second quarter of 2026, published on August 18, 2026:
The Census figures cover online sales of retailers, measured in the same way as store sales, which makes them more reliable than vendor estimates. They exclude services such as travel or event tickets, so they understate the full digital economy. The next release, with revised figures, is scheduled for November 19, 2026.
According to Eurostat, 77% of internet users in the European Union bought or ordered goods or services online for personal use in 2024, against 59% in 2014. The gaps between countries remain large: Ireland (96%), the Netherlands (94%) and Denmark (91%) lead, while Bulgaria (57%), Italy and Romania (60%) trail. Clothing, shoes and accessories are the most purchased category, bought online by 45% of people in the three months before the survey.
In France, the Fevad (the French ecommerce federation) reports for 2025:
| Indicator (France, 2025) | Figure |
|---|---|
| Online sales, products and services | €196.4 billion, up 7% |
| Growth of product sales / service sales | +4% / +9% |
| Number of online transactions | 3.2 billion, up 11% |
| Online shoppers | 42.2 million, 80% of people aged 16 to 74 |
| Purchases per online shopper per year | 75 |
| Annual online spending per shopper | €4,657 |
| Active merchant websites | More than 158,000, up 7% |
Transactions grow faster than revenue: French shoppers buy more often, for smaller amounts. That pattern rewards stores that are visible on many small, specific searches rather than on a few generic ones.
The most precise public measure comes from Adobe Analytics, which observes more than one trillion visits to US retail sites. During the 2025 holiday season (November 1 to December 31):
The practical consequence is simple: product pages, category pages and checkout are judged first on a phone screen. Google also indexes the mobile version of sites first, as explained in our guide to mobile SEO.
The Baymard Institute calculates a documented average cart abandonment rate of 70.22%, based on 50 studies (page updated in September 2025). Excluding the shoppers who were "just browsing", the main reasons given by US online shoppers are:
| Reason for abandoning a cart | Share of shoppers |
|---|---|
| Extra costs too high (shipping, tax, fees) | 40% |
| Delivery too slow | 20% |
| Did not trust the site with card details | 19% |
| Site required creating an account | 18% |
| Checkout too long or complicated | 17% |
| Website errors or crashes | 17% |
| Unsatisfactory returns policy | 13% |
| Could not see total order cost up front | 12% |
Most of these causes are visible before checkout: display shipping costs and delivery times on the product page, offer guest checkout, and show trust signals. Our conversion rate calculator helps estimate what a few points of abandonment are worth.
Generative AI has become a new entry point to stores, and the first measurements show fast growth from a small base:
For a store, this means product information must be readable by machines as well as by people: complete product feeds in Google Merchant Center, structured data on product pages, and pages that answer buyers' questions. We detail these changes in our guides to AI shopping and AI in ecommerce.
The figures point to five priorities for an online store that wants to be found on Google and recommended by ChatGPT, Gemini or Perplexity:
To estimate what organic traffic could bring to your store, try the ecommerce SEO ROI calculator. For broader search figures, see our pages of SEO statistics and Google search statistics.
Three rules avoid the most common errors. First, always give the scope and the date: a share of retail in the United States is not a share of the world market, and a holiday season is not a year. Second, prefer primary sources (statistics agencies, federations, published studies) over figures repeated by blogs without a link. Third, update your pages when a new edition is released: the Census publishes every quarter and the Fevad every year, and an outdated figure weakens the credibility of a whole page, including in the eyes of the AIs that cite it.
Ecommerce keeps gaining share, shoppers buy more often on their phones, and a new channel is opening through AI assistants. The stores that win are those whose product information is complete, fast to load and easy for both people and machines to read. To publish the content that brings this traffic on autopilot, connect your store to Sorank on Shopify or any other platform, and track how ChatGPT, Claude and Gemini talk about your brand.

In the United States, ecommerce represented 17.1% of total retail sales in the second quarter of 2026, according to the US Census Bureau. The share varies by country and by category: it is much higher for electronics or books than for groceries. In France, the Fevad measures online sales including services, which reached 196.4 billion euros in 2025.
According to Eurostat, Ireland had the highest share in 2024, with 96% of internet users buying online, followed by the Netherlands at 94% and Denmark at 91%. Bulgaria had the lowest share at 57%. The EU average was 77% of internet users aged 16 to 74.
Reliability depends on the source. Official agencies such as the US Census Bureau and Eurostat, trade federations such as the Fevad and published research such as Baymard's are the most dependable. Figures repeated without a link, without a date or without a defined scope should be treated with caution until the original publication is found.
 AI Content Brief Generator
 FAQ Schema Generator
 AI Blog Post Ideas Generator
 Structured Data Validator
 Alt Text Checker
 Internal Link Analyzer
 Backlink Challenge
 AI Meta Description Generator
 AI Blog Title Generator
 Google Indexability Checker
 AI Blog Outline Generator
 UTM Link Builder
 Keyword Clustering Tool
 Canonical Tag Checker
 XML Sitemap Generator
 Broken Link Checker
 AI SEO Title Generator
 Headline Analyzer
 SERP Preview Tool
 Redirect Checker
 Hreflang Tag Generator
 Heading Structure Analyzer
 HTTP Headers Checker
 Favicon Extractor
 SERP CTR Calculator
 SEO vs Paid Search Savings Calculator
 SEO Share of Voice Calculator
 SEO ROI Calculator
 SEO Traffic and Revenue Forecast Calculator
 SEO Budget Calculator
 SEO Break-Even Calculator
 SaaS SEO ROI Calculator
 ROAS Calculator
 Reading Time Calculator
 Ranking Gain Simulator
 Organic Traffic Value Calculator
 Organic Traffic Estimator
 LTV to CAC Ratio Calculator
 Local SEO ROI Calculator
 Link Building Cost Calculator
 Keyword Value Calculator
 Keyword Opportunity Score Calculator
 Keyword Density Calculator
 GEO ROI Calculator
 GEO Content Investment Calculator
 Ecommerce SEO ROI Calculator
 Customer Lifetime Value Calculator
 Customer Acquisition Cost Calculator
 CTR Calculator
 Cost Per Article Calculator
 Conversion Rate Calculator
 Content Marketing ROI Calculator
 ChatGPT Referral Traffic Estimator
 Bounce Rate Calculator
 Backlink ROI Calculator
 AI Visibility Score Calculator
 AI Traffic Value Calculator
 AI Share of Voice Calculator
 Cost of AI Invisibility Calculator
 AI Citation Rate Calculator
 llms.txt Validator
 AI Overview Checker
 Robots.txt Checker
 AI SEO Audit
 LLM Readability Checker
 SearchGPT Readiness Checker
 Structured Data LLM Audit
 Website Crawlability AI Audit
 Why ChatGPT Is Not Recommending My Website
 Gemini Ranking Tool
 Perplexity Ranking Checker
 LLM Citation Checker
 Answer Engine Optimization Audit
 GEO Audit
 AI Search Visibility Test
 ChatGPT Visibility Checker
 llms.txt Generator
 URL Extractor
 Webpage to Markdown
 Sitemap Checker
 SERP Volatility Sensor
 Page Size Checker
 Word Counter
 Slug Generator
 Schema Generator
 Robots Generator
 OG Preview
 Meta Tags Generator
 Image Compressor
 Favicon Generator
 On-Page SEO Audit
 Backlink Analysis Tool
 Keyword Research Tool
 Domain Authority Checker
THEY TRIED SORANK BEFORE YOU
 “I tested Sorank on a real client site and it's insane. It does everything an agency would bill you $1500 a month for. It's going into production on that client now.”

 Guillaume Guersanguersanguillaume.com“We are an Ads agency and we wanted to get our SEO back on track once and for all. Sorank gave us a clear view of our site, helped us prioritize optimizations, and properly structure our content. The tool is easy to use, well designed for a team, and very practical for centralizing tracking without having to juggle multiple platforms. A very solid foundation to start fresh with our SEO.”
 Gaspard MadouiAds Agency
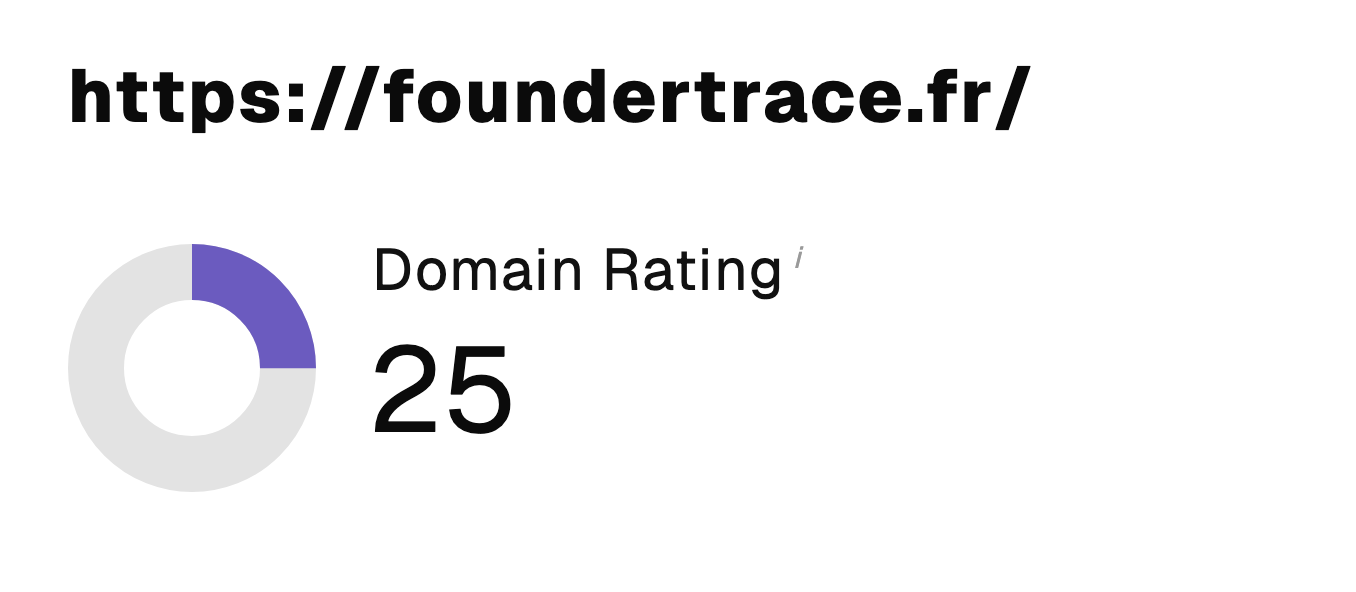 “I just let the Sorank software do its thing, and now my DR is 25 and my page is ranking higher.”
 Lucas Flandrefoundertrace.fr“I specialized in GEO thanks to Sorank. The GEO Leaderboard allows me to show my clients their position vs competitors on ChatGPT. It’s a real commercial differentiator.”
 MélanieSEO Freelance“Great service, works well for our website and helps us understand how to improve it to rank better on Google and elsewhere. Congrats, keep going, I recommend it.”
 Hugo T.E-commerce merchant