Preferences
Privacy is important to us, so you have the option of disabling certain types of storage that may not be necessary for the basic functioning of the website. Blocking categories may impact your experience on the website. More information

Privacy is important to us, so you have the option of disabling certain types of storage that may not be necessary for the basic functioning of the website. Blocking categories may impact your experience on the website. More information

How to set a marketing budget: 2026 benchmarks as a share of revenue, the four sizing methods, a channel split table and how to fund SEO and GEO.

Tools


In short
a marketing budget is the amount a company commits to marketing over a year or a quarter, covering media, content, tools, agencies and the people who run them. Large companies spend around 8% of revenue on marketing (7.8% in the Gartner 2026 CMO Spend Survey), and the median company in The CMO Survey 2026 spends 5%. Set the total with a percentage of revenue, check it against your growth goals and your customer acquisition cost, then split it between channels that pay back fast (paid media) and channels that compound (SEO, content, GEO).
Want to go further? Ask
A marketing budget answers two questions at once: how much the company can afford to invest in growth, and where each euro or dollar produces the most customers. The figures in this guide come from two primary surveys: the Gartner 2026 CMO Spend Survey (401 marketing leaders, mostly at companies above $1 billion in revenue, published May 2026) and the The CMO Survey 2026 run by Duke University, Deloitte and the American Marketing Association (308 US marketing leaders, January 2026).
A complete marketing budget covers every cost needed to attract, convert and retain customers, not only advertising. Forgetting a line is the most common reason budgets are exceeded in the second half of the year.
An advertising budget is only one part of this list. Whether salaries are included changes the benchmark completely, so always check what a published percentage covers before comparing yourself to it.
There is no universal figure, but published surveys give a reliable range. The average marketing budget sits between 7% and 10% of revenue, with a wide spread around it.
| Source | Sample | Marketing budget |
|---|---|---|
| Gartner CMO Spend Survey 2026 | 401 CMOs, mostly companies above $1 billion revenue | 7.8% of revenue (7.7% in 2025) |
| The CMO Survey 2026, mean | 154 US companies answering this question | 8.96% of revenue |
| The CMO Survey 2026, median | Same sample | 5% of revenue |
| The CMO Survey 2026 | 146 US companies | 9.64% of total company budget (median 7%) |
The gap between the mean (8.96%) and the median (5%) in The CMO Survey shows that a few heavy spenders pull the average up: half of the companies spend 5% of revenue or less. Gartner also reports that 56% of CMOs say they lack the budget to deliver their 2026 strategy, and that marketing teams now put 15.3% of their budget into AI initiatives.
Three factors move a company above or below these averages:
Most companies combine two methods: a top-down percentage to frame the total, and a bottom-up calculation to check it can reach the goals.
Take last year's revenue (or next year's forecast) and apply a percentage, usually between 5% and 10%. It is simple and easy to defend in front of finance, but it links marketing to past results: when sales drop, the budget drops exactly when you need demand.
Start from the goal and work backwards. Example: 400 new customers next year, a close rate of 20% on qualified leads, so 2,000 leads; at a cost per lead of $60, the acquisition budget is $120,000, plus tools and content. This method ties every dollar to an outcome, and the customer acquisition cost calculator gives you the starting figure.
Estimate what competitors spend (visible ads, content volume, events) and match or exceed it on the channels where you want share of voice. Useful as a check, risky as the only method, because competitors may have different margins and goals.
Decide the maximum you can pay for a customer from their lifetime value. A common rule of thumb in software is a lifetime value at least three times the acquisition cost. Check your own figures with the LTV to CAC ratio calculator, then multiply the acceptable cost per customer by the number of customers you want.
| Method | Best for | Main limit |
|---|---|---|
| Percentage of revenue | Stable companies, annual planning | Follows past revenue, not opportunity |
| Objective and task | Growth targets, new markets | Needs reliable conversion data |
| Competitive parity | Crowded markets | Copies others' strategy and margins |
| Unit economics | Subscription and e-commerce | Needs a known lifetime value |
The split depends on how fast you need results and how long you can wait for them. Paid media buys immediate traffic that stops when spending stops; SEO, content and GEO take months to start but keep producing leads without a cost per click. Define the balance with your marketing mix and write it into your marketing plan.
The table below is a starting split for a company spending $10,000 a month on acquisition (people excluded). It is an example to adapt, not a benchmark.
| Channel | Share | Monthly amount | When results appear |
|---|---|---|---|
| Search ads (Google, Microsoft) | 30% | $3,000 | Days |
| Social ads and retargeting | 20% | $2,000 | Days to weeks |
| SEO, content and GEO | 25% | $2,500 | 2 - 6 months, then cumulative |
| Email and retention | 10% | $1,000 | Weeks |
| Tools and analytics | 10% | $1,000 | Supports all channels |
| Tests and reserve | 5% | $500 | Variable |
Two rules keep the split healthy. First, fund each channel enough to be measurable: $300 a month spread over five ad networks teaches you nothing. Second, review the allocation every quarter and move money towards the channels with the best cost per customer, using the ROAS calculator for paid campaigns. On Google Ads, remember that you set an average daily budget: Google can spend up to twice that amount on a given day, within a monthly cap of 30.4 times the daily budget, as explained in its help page on average daily budgets. Our guide to Google Ads costs details typical cost per click by sector.
SEO and GEO (generative engine optimization, being cited by ChatGPT, Gemini, Claude and Perplexity) are the channels whose returns accumulate: an article that ranks in month four still brings visitors in month twenty, without paying for each click. Their weakness is the delay, which is why budgets that are cut each quarter rarely give them time to work.
To size this line, the SEO budget calculator estimates a monthly amount from your goals, and the SEO break-even calculator shows how many months it takes for organic traffic to pay back its cost. Our article on SEO cost compares agency, freelance and software prices.
GEO deserves its own line in 2026. The CMO Survey 2026 found that 41.5% of companies using AI in marketing already use it to appear in AI-generated search results. Being cited depends on sources that AI assistants trust, and our study of AI citations in the marketing sector shows which types of pages they pick.
With a few hundred or a few thousand a month, concentration beats coverage. The methods in our guide to small business marketing follow the same logic:
A budget is a forecast; tracking turns it into a management tool. Keep a simple spreadsheet with one line per channel and four columns: planned, actual, leads or sales generated, cost per result. Then follow this rhythm:
Judge long-term channels on the right horizon: a content program measured after six weeks always looks worse than paid ads. Align the review with your content marketing strategy so that content is judged on traffic, leads and citations after six to twelve months.
Start from a percentage of revenue (5% to 10% covers most companies), check it against your goals and your acceptable cost per customer, and split it between channels that bring results now and channels that compound. The healthiest marketing budget funds paid media for this quarter and SEO and GEO for the next ones. To produce optimized articles, track your AI citations and earn backlinks for a fixed monthly price, see Sorank's plans, from $49 per month on an annual plan, with a 3-day free trial.

Most small businesses spend between 5% and 10% of revenue on marketing. The median company in The CMO Survey 2026 spends 5%, while the mean is close to 9%. A young company that needs to win customers quickly often goes above this range for a year or two, then lowers the share as revenue grows.
It depends on how your company reports costs, but the choice must be explicit. Including salaries gives the true cost of marketing and makes the budget comparable with surveys that count people. Excluding them gives a working budget for media, content and tools, which is easier to manage month to month.
Track spending against plan every month and reallocate every quarter. Pause campaigns whose cost per result exceeds your ceiling each month, and move 10 to 20% of the budget towards the best channels each quarter. Rebuild the budget from your goals once a year rather than adding a percentage to last year's figures.
 AI Content Brief Generator
 FAQ Schema Generator
 AI Blog Post Ideas Generator
 Structured Data Validator
 Alt Text Checker
 Internal Link Analyzer
 Backlink Challenge
 AI Meta Description Generator
 AI Blog Title Generator
 Google Indexability Checker
 AI Blog Outline Generator
 UTM Link Builder
 Keyword Clustering Tool
 Canonical Tag Checker
 XML Sitemap Generator
 Broken Link Checker
 AI SEO Title Generator
 Headline Analyzer
 SERP Preview Tool
 Redirect Checker
 Hreflang Tag Generator
 Heading Structure Analyzer
 HTTP Headers Checker
 Favicon Extractor
 SERP CTR Calculator
 SEO vs Paid Search Savings Calculator
 SEO Share of Voice Calculator
 SEO ROI Calculator
 SEO Traffic and Revenue Forecast Calculator
 SEO Budget Calculator
 SEO Break-Even Calculator
 SaaS SEO ROI Calculator
 ROAS Calculator
 Reading Time Calculator
 Ranking Gain Simulator
 Organic Traffic Value Calculator
 Organic Traffic Estimator
 LTV to CAC Ratio Calculator
 Local SEO ROI Calculator
 Link Building Cost Calculator
 Keyword Value Calculator
 Keyword Opportunity Score Calculator
 Keyword Density Calculator
 GEO ROI Calculator
 GEO Content Investment Calculator
 Ecommerce SEO ROI Calculator
 Customer Lifetime Value Calculator
 Customer Acquisition Cost Calculator
 CTR Calculator
 Cost Per Article Calculator
 Conversion Rate Calculator
 Content Marketing ROI Calculator
 ChatGPT Referral Traffic Estimator
 Bounce Rate Calculator
 Backlink ROI Calculator
 AI Visibility Score Calculator
 AI Traffic Value Calculator
 AI Share of Voice Calculator
 Cost of AI Invisibility Calculator
 AI Citation Rate Calculator
 llms.txt Validator
 AI Overview Checker
 Robots.txt Checker
 AI SEO Audit
 LLM Readability Checker
 SearchGPT Readiness Checker
 Structured Data LLM Audit
 Website Crawlability AI Audit
 Why ChatGPT Is Not Recommending My Website
 Gemini Ranking Tool
 Perplexity Ranking Checker
 LLM Citation Checker
 Answer Engine Optimization Audit
 GEO Audit
 AI Search Visibility Test
 ChatGPT Visibility Checker
 llms.txt Generator
 URL Extractor
 Webpage to Markdown
 Sitemap Checker
 SERP Volatility Sensor
 Page Size Checker
 Word Counter
 Slug Generator
 Schema Generator
 Robots Generator
 OG Preview
 Meta Tags Generator
 Image Compressor
 Favicon Generator
 On-Page SEO Audit
 Backlink Analysis Tool
 Keyword Research Tool
 Domain Authority Checker
THEY TRIED SORANK BEFORE YOU
 “I tested Sorank on a real client site and it's insane. It does everything an agency would bill you $1500 a month for. It's going into production on that client now.”

 Guillaume Guersanguersanguillaume.com“We are an Ads agency and we wanted to get our SEO back on track once and for all. Sorank gave us a clear view of our site, helped us prioritize optimizations, and properly structure our content. The tool is easy to use, well designed for a team, and very practical for centralizing tracking without having to juggle multiple platforms. A very solid foundation to start fresh with our SEO.”
 Gaspard MadouiAds Agency
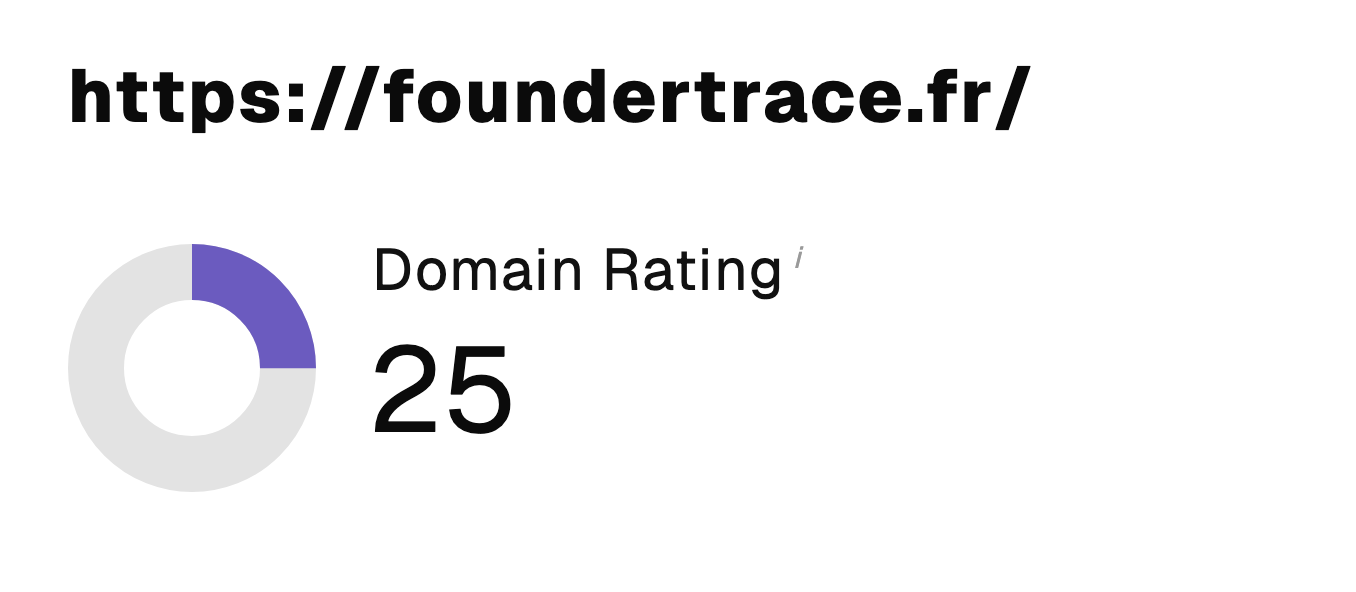 “I just let the Sorank software do its thing, and now my DR is 25 and my page is ranking higher.”
 Lucas Flandrefoundertrace.fr“I specialized in GEO thanks to Sorank. The GEO Leaderboard allows me to show my clients their position vs competitors on ChatGPT. It’s a real commercial differentiator.”
 MélanieSEO Freelance“Great service, works well for our website and helps us understand how to improve it to rank better on Google and elsewhere. Congrats, keep going, I recommend it.”
 Hugo T.E-commerce merchant