



Content marketing is one of the most debated line items in any digital budget: teams know it works but struggle to put a number on the return. This content marketing ROI calculator gives you a clear figure from four inputs: your total content investment, the monthly visits that content generates, your conversion rate and the value of each conversion. Set your time horizon and use the calculator above to see total revenue, ROI percentage and cost per conversion.
How content marketing ROI is calculated
The formula links investment to output through a simple conversion funnel:
- Conversions per month = Monthly visits x Conversion rate
- Revenue over period = Conversions per month x Value per conversion x Horizon (months)
- ROI = (Revenue - Investment) / Investment x 100
- Cost per conversion = Investment / (Conversions per month x Horizon)
Step-by-step example. You invest 6000€ in content over 12 months. That content generates 4000 visits per month with a 1.5% conversion rate and each conversion is worth 150€. Conversions per month = 4000 x 0.015 = 60. Revenue = 60 x 150€ x 12 = 108000€. ROI = (108000€ - 6000€) / 6000€ x 100 = 1700%. Cost per conversion = 6000€ / (60 x 12) = 8.33€. These are model outputs; your numbers depend on content quality, topic selection and sales process.
How to interpret and improve your result
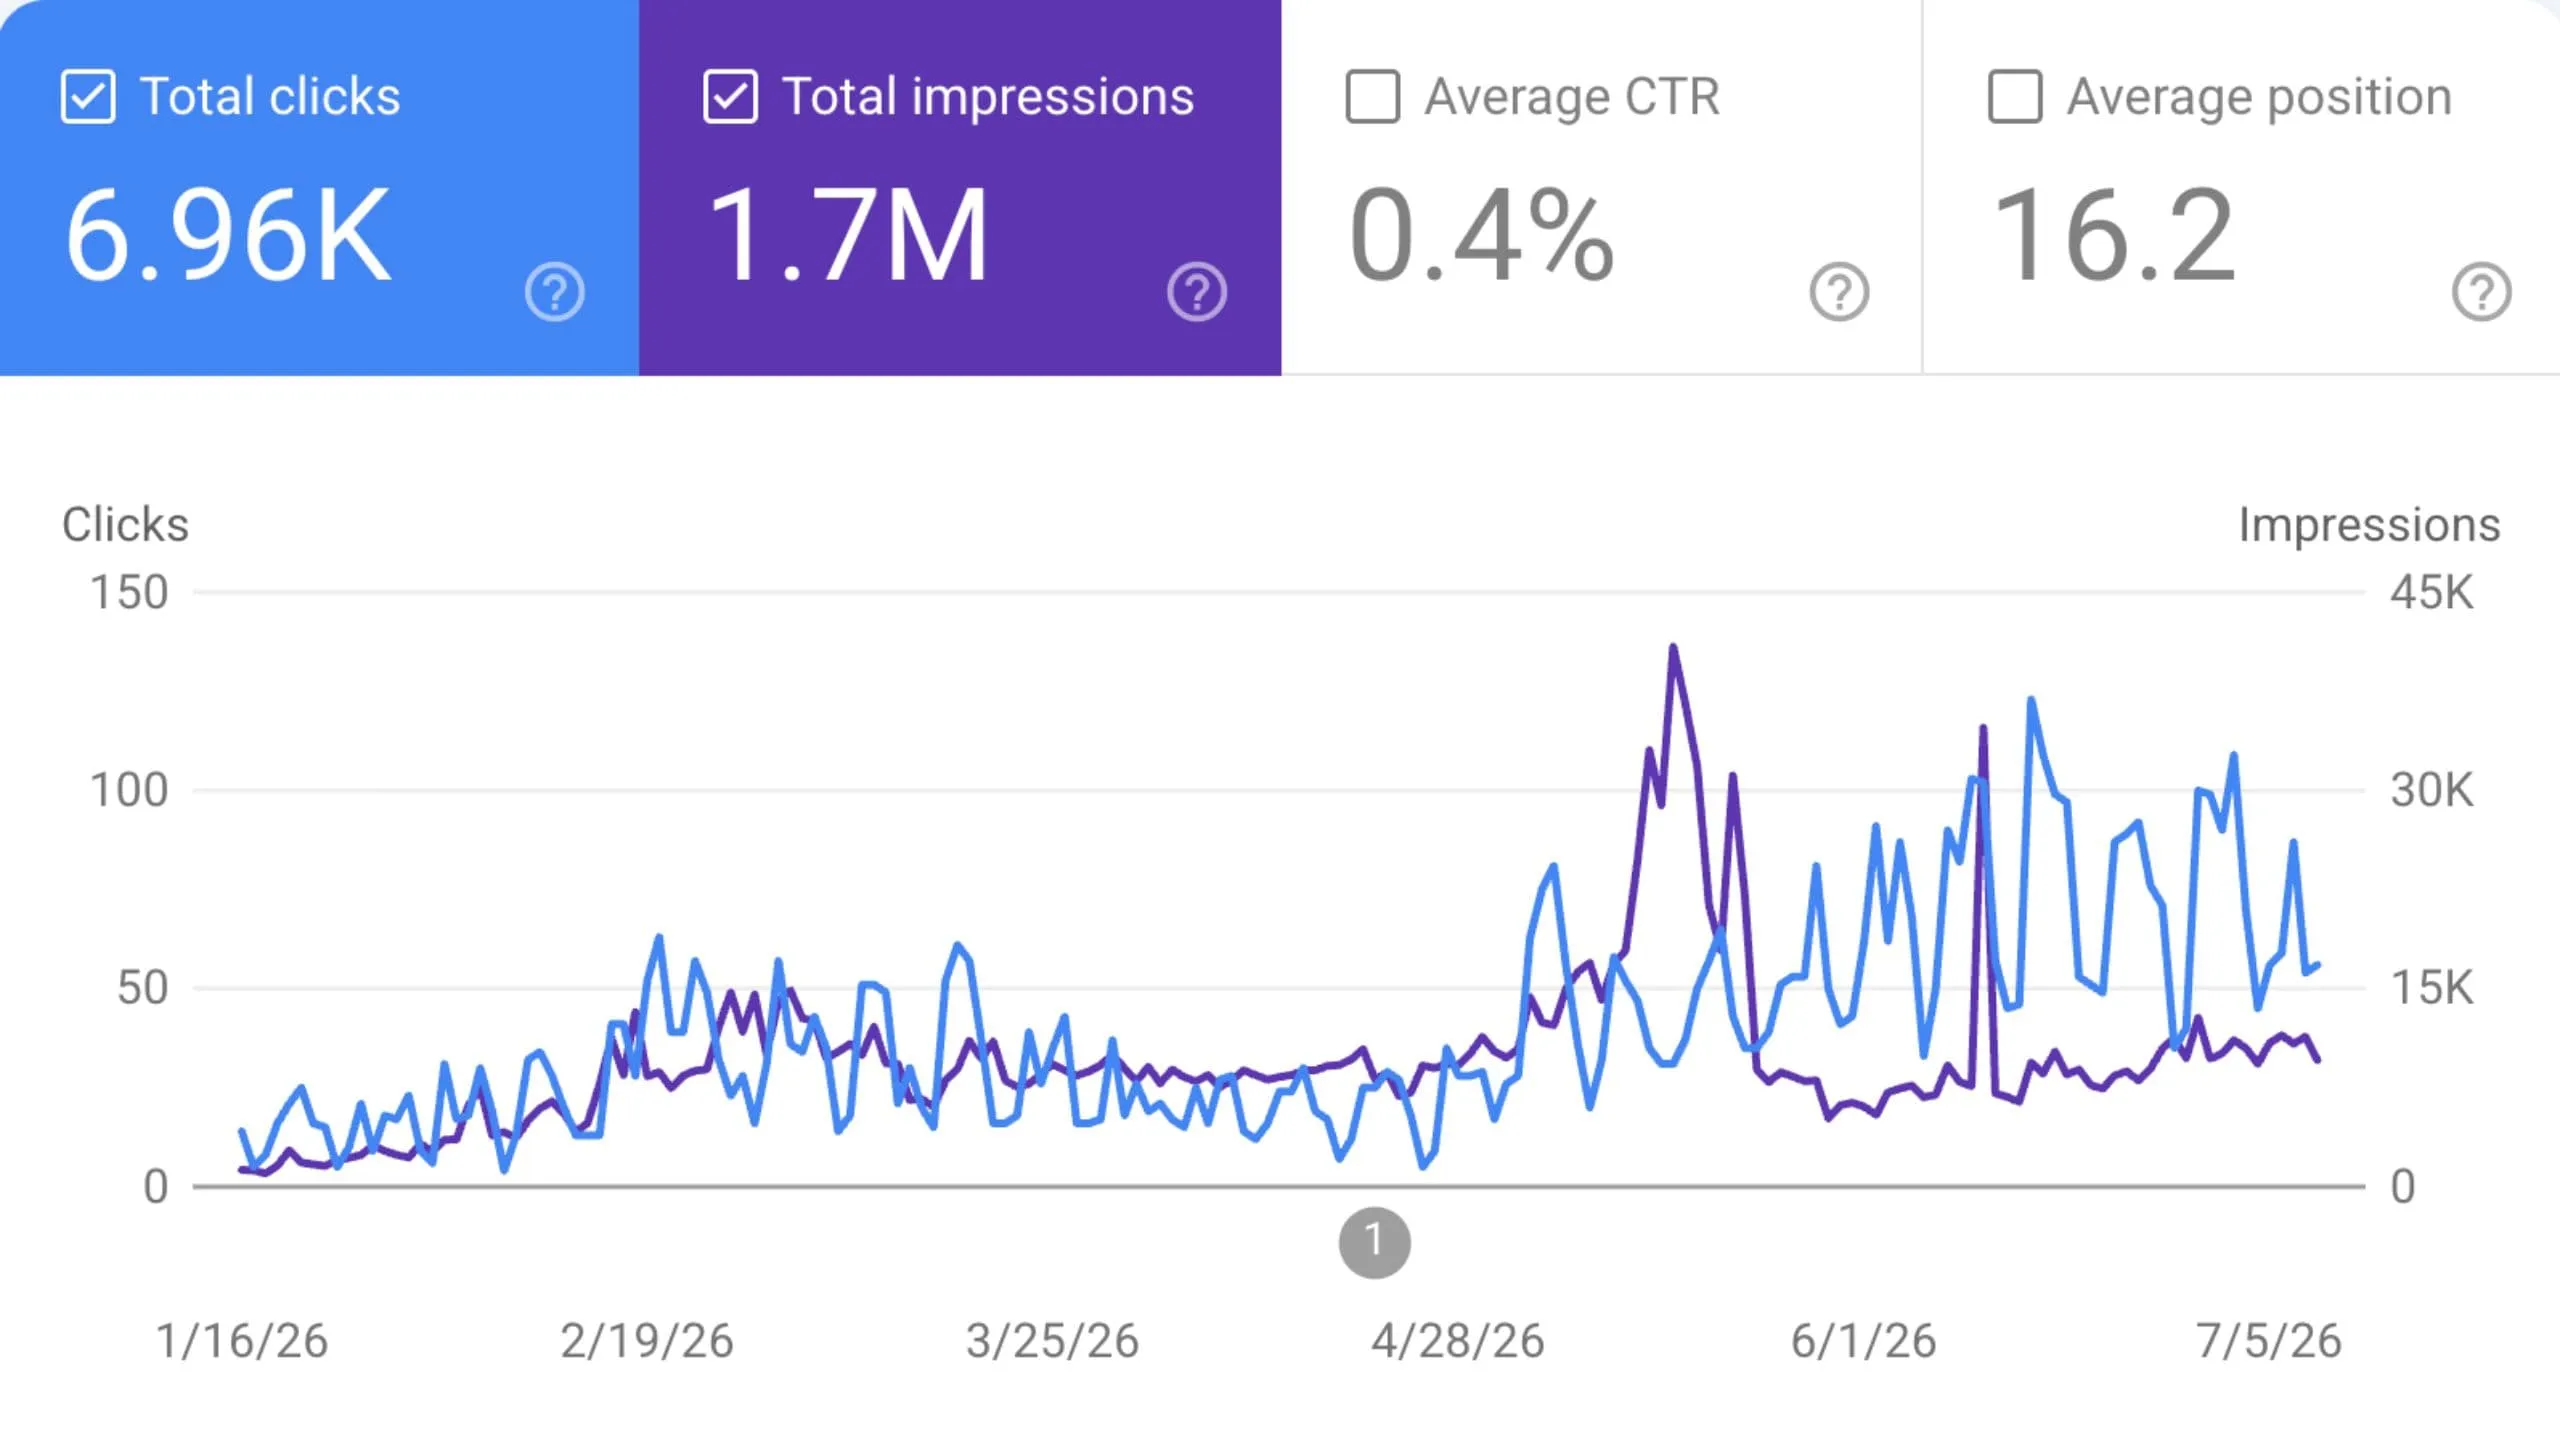
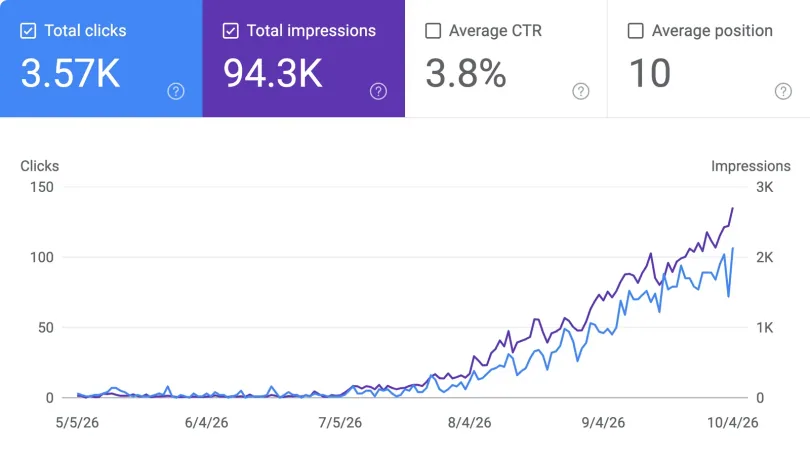
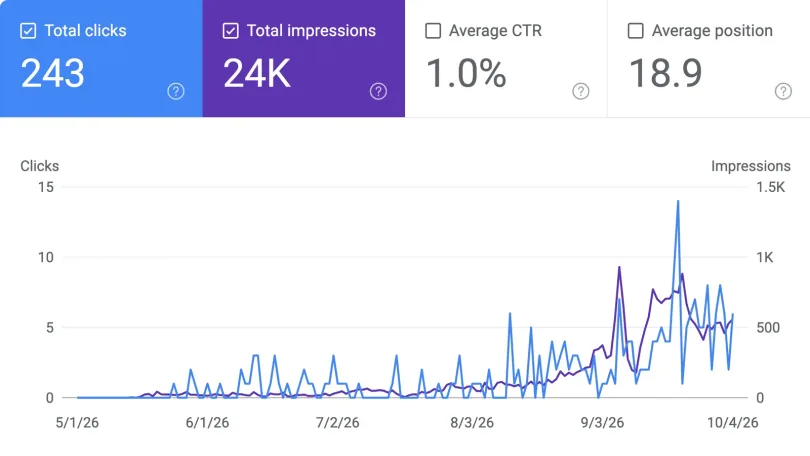
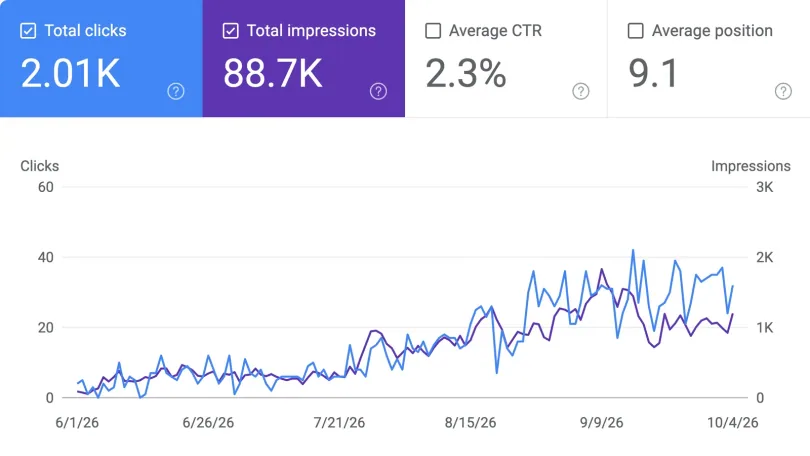
- Start with realistic traffic estimates. Plug in only the organic visits your content is currently generating, not your overall site traffic. Use Google Search Console to filter content-driven sessions. Overstating traffic inflates ROI projections and leads to bad decisions.
- Use your actual conversion rate, not an industry average. The benchmark across all industries is around 2.6% (First Page Sage, 2026). If your rate is lower, focus first on improving the page experience, calls to action and offer clarity before scaling content production.
- Extend the horizon for content that compounds. Blog posts and guides accumulate traffic over months. If a piece published in month 1 is still generating visits in month 12, a 12-month horizon understates total ROI. Consider running separate calculations for evergreen pieces.
- Compare cost per conversion to paid acquisition. If your cost per conversion from content is 8€ and your paid search cost per conversion is 45€, you have a strong argument for reinvesting in content. This comparison also helps justify budget increases to stakeholders.
- Monitor AI-driven traffic separately. Visits from AI assistants such as ChatGPT and Perplexity convert at roughly 7%, about three times the SEO average. If your analytics separates this source, track it with a higher conversion rate in the calculator for a more accurate revenue split.
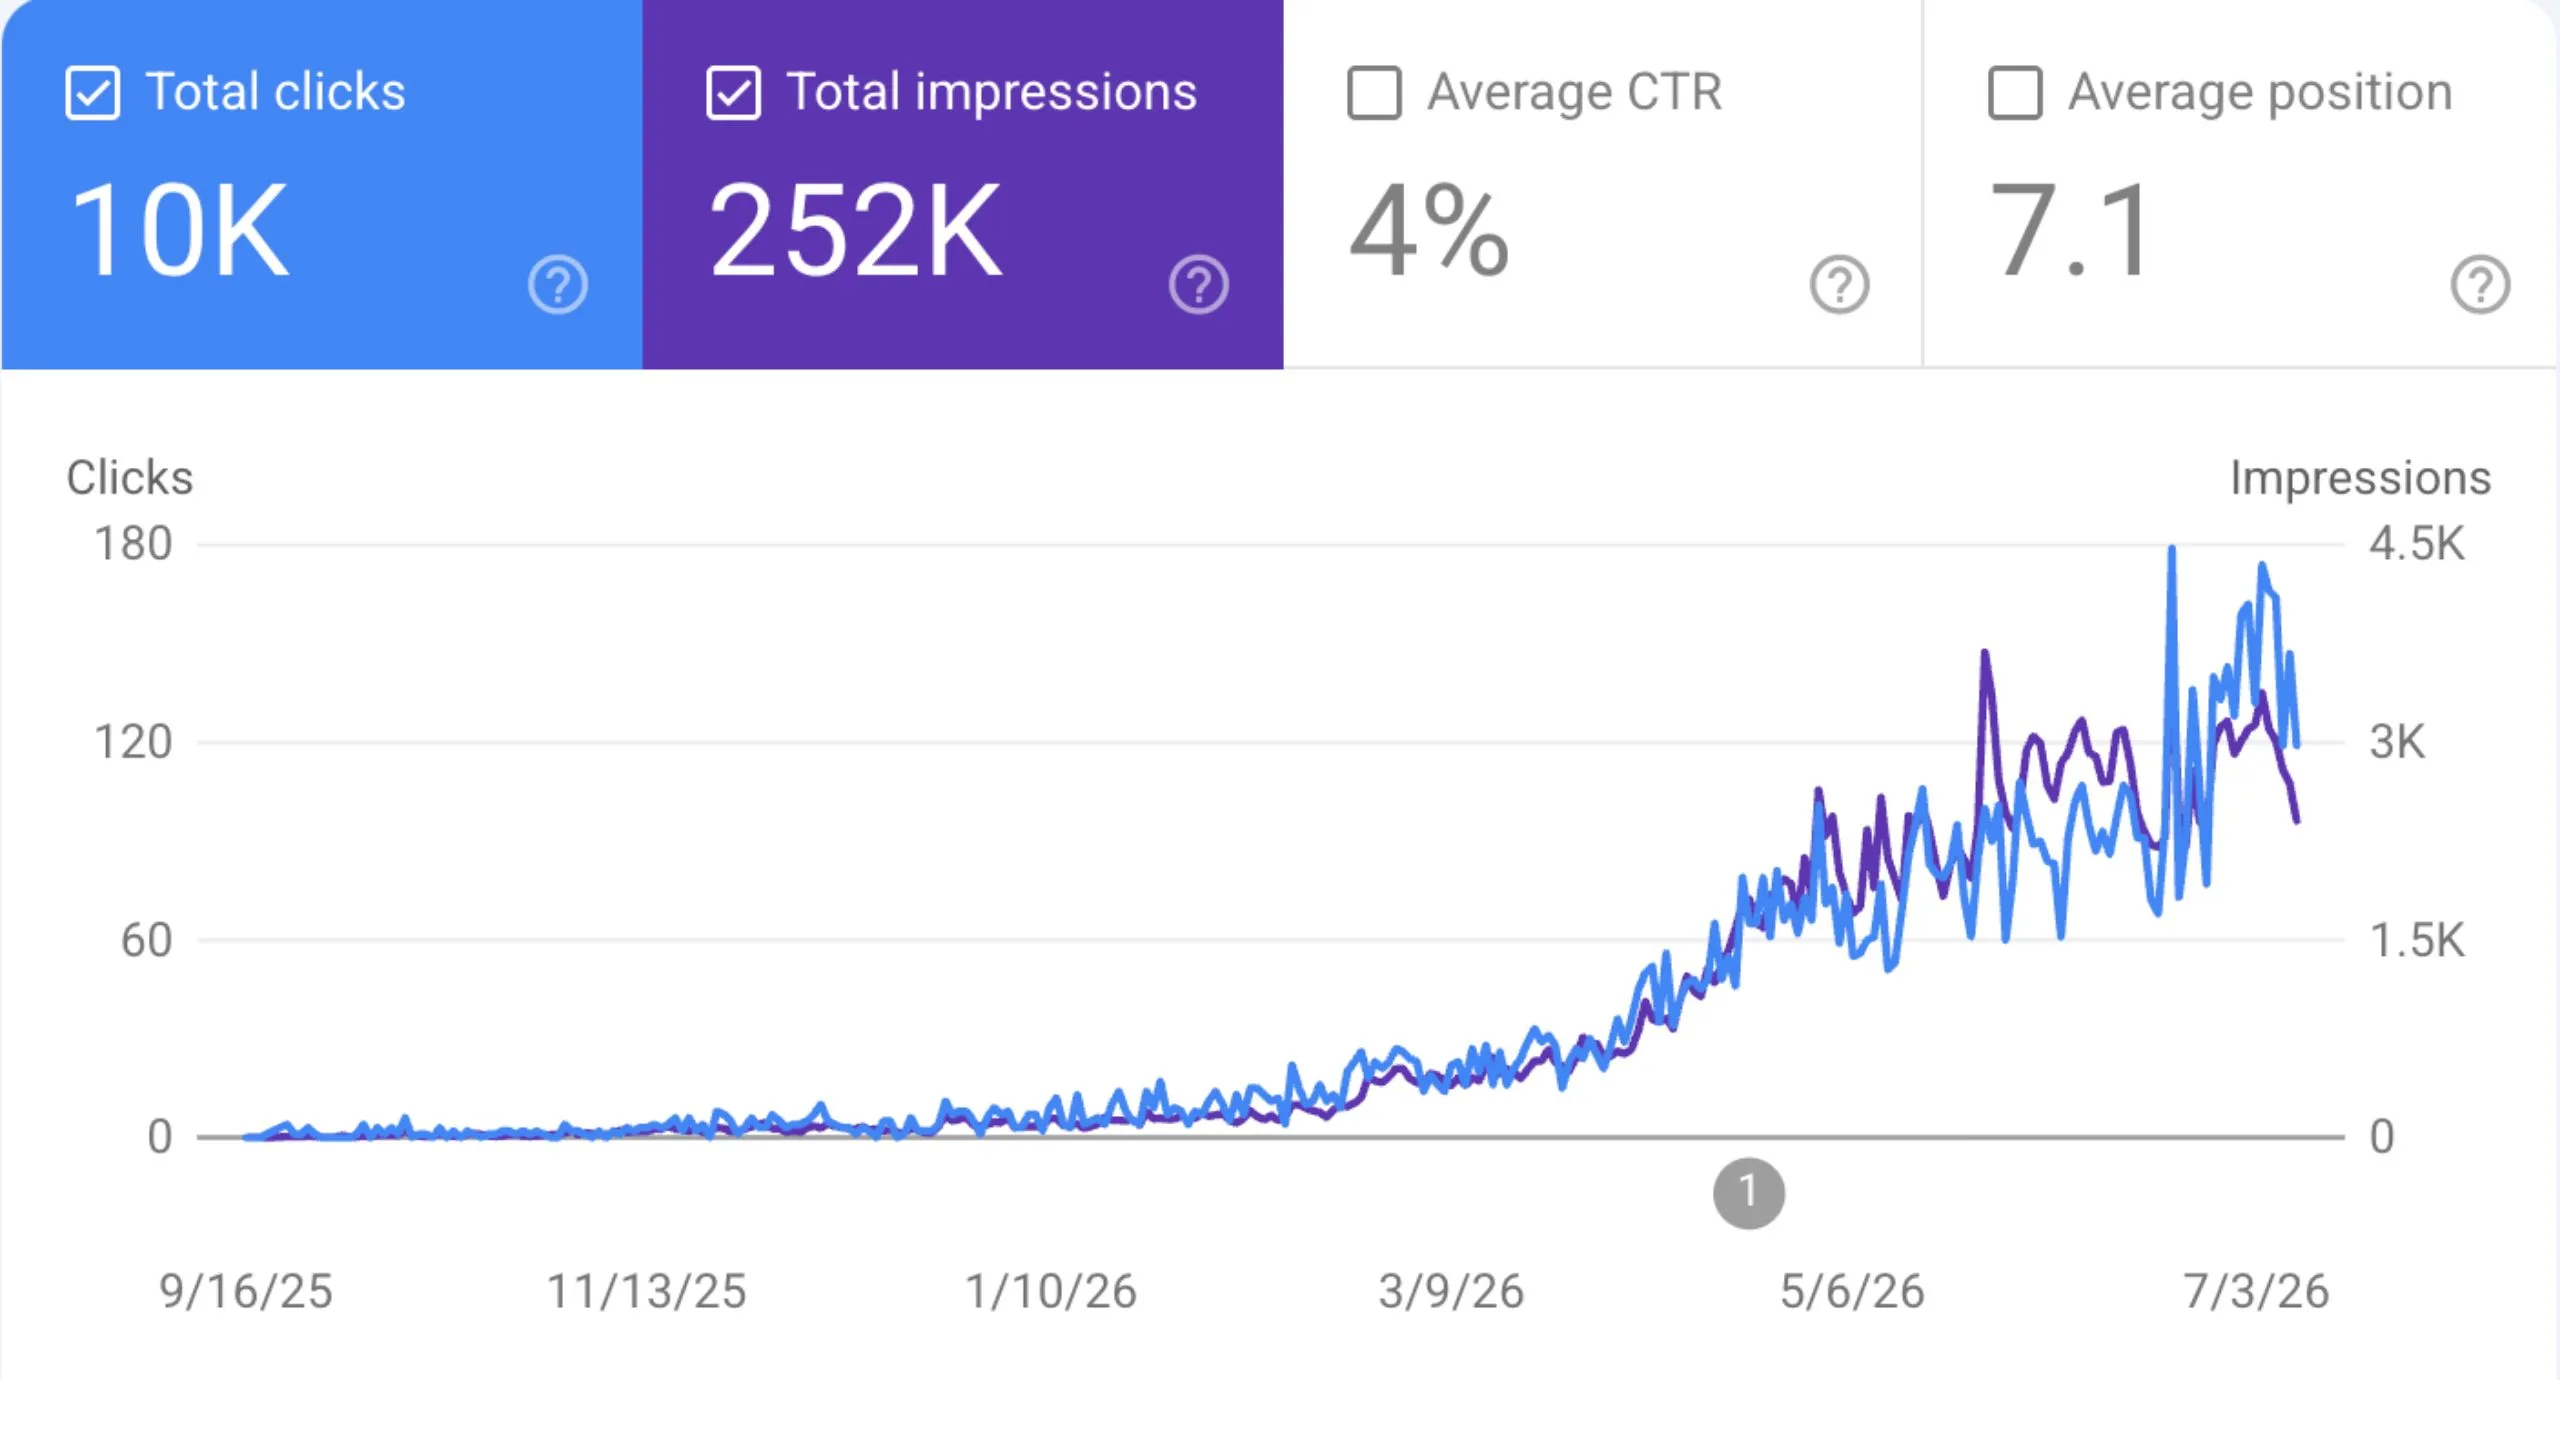
- Revisit monthly as traffic builds. Content ROI improves over time as articles rank higher and accumulate backlinks. Update the calculator every quarter with fresh traffic data to track the compounding effect.
Benchmark reference
Studies tracking SaaS B2B SEO at a baseline investment of around 120000$/year report average ROI of 702% with a break-even point at 7 months (First Page Sage, 2026). E-commerce content programmes show around 317% ROI. These figures vary by industry, content quality and competitive landscape. Treat them as indicative targets, not guarantees.
If you want to track which content pages drive the most organic and AI visibility over time, Sorank connects ranking data to revenue reporting in one place.