Preferences
Privacy is important to us, so you have the option of disabling certain types of storage that may not be necessary for the basic functioning of the website. Blocking categories may impact your experience on the website. More information

Privacy is important to us, so you have the option of disabling certain types of storage that may not be necessary for the basic functioning of the website. Blocking categories may impact your experience on the website. More information

Data study of 7575 AI answers in Entertainment: which platforms the AIs cite in this sector, how it differs from the general ranking, and what to do about it.

Summarize this article with AI
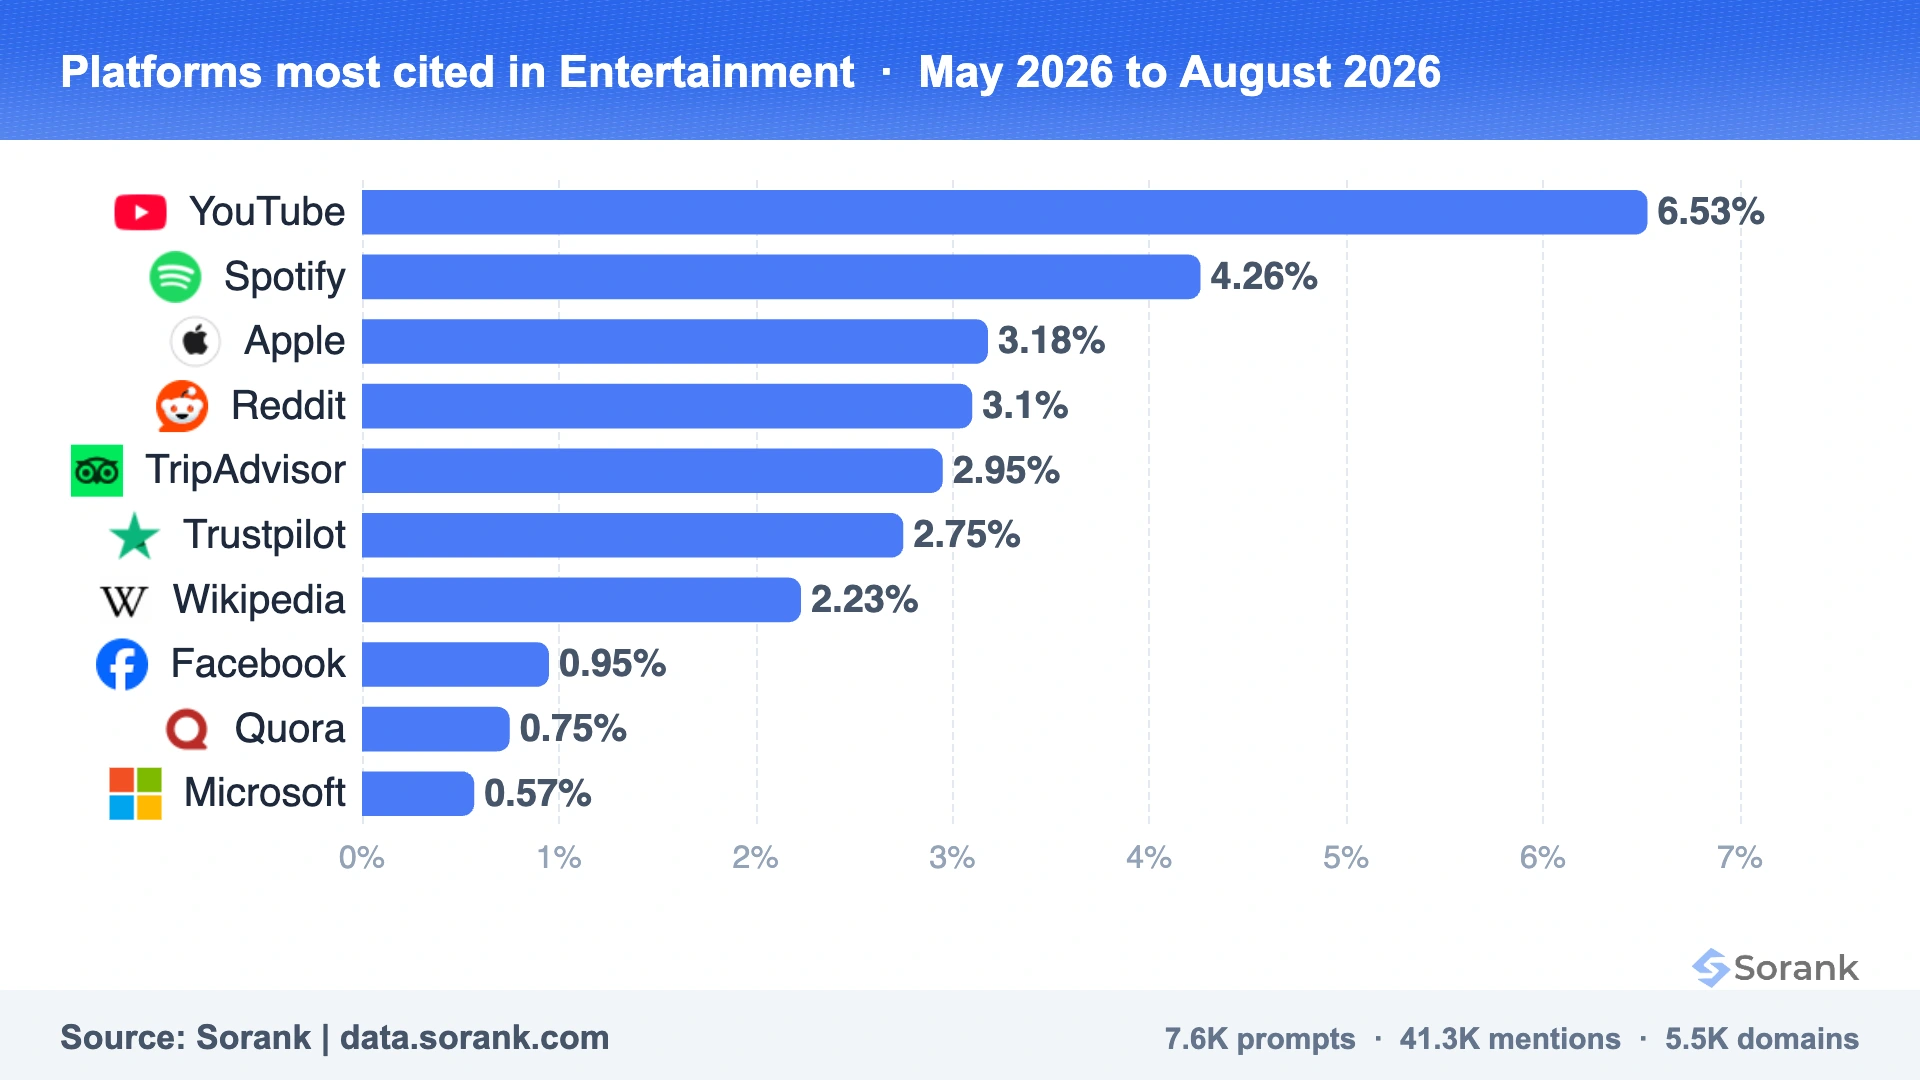
In Entertainment, 7575 AI answers were measured between May 2026 and August 2026. The most cited platform is YouTube at 6.53%, ahead of Spotify at 4.26%. That ranking differs from the general one: Spotify is cited 23.7 times more here than in the general ranking.
Entertainment is the sector with the most extreme over indexing: a streaming platform is cited more than twenty times its general rate.
A citation rate of 2% means the source was cited twice for every 100 measured answers. Rates are computed per model against the number of answers of that model, so a model with a smaller sample never distorts a column. A source cited several times inside one answer is counted once per company block, which keeps a single verbose answer from dominating a month.
The distribution is worth as much as the ranking. The top three sources hold 51% of the citations counted in this table, 7 platforms sit above 1%, and YouTube is cited 1.5 times more often than Spotify. A market where three sources hold most of the citations rewards depth on those three rather than presence everywhere.
This sector was measured on 7575 answers, 69.6% of them in French, across 3 of the five models (ChatGPT, Gemini, Perplexity). The language mix matters when you read the ranking, because local platforms weigh more in French speaking markets.
This sector was measured over 4 months, between May 2026 and August 2026, on 7575 answers, and 33 platforms recorded at least one citation. Its leading source, YouTube, fell from 12.38% in May 2026 to 1.03% in August 2026, which is the kind of movement that makes a ranking older than one quarter unreliable.
Answers about music, film and shows are built from the catalogues themselves. Video and streaming platforms carry the citations, and everything else follows at a distance. For a company in this sector, the conclusion is direct: presence in the catalogue is presence in the answer. Owning a page about your work matters far less than having the work correctly listed, tagged and described where the catalogue lives.
Every number on this page comes from the public Sorank dataset. The underlying figures, the monthly detail and the filters are available here:
Open the source data on data.sorank.com
Data updated on 2026-08-26.
This study is free to quote, in an article, a deck or a report. Please cite the source and the measurement period, because the numbers move every month.
Sorank (2026). Entertainment AI Citation Study: 7575 AI Answers Measured. Sorank GEO studies, measured on 301025 AI answers collected between August 2025 and August 2026. Available at https://www.sorank.com/data/entertainment-ai-citation-study
The same panel, read from another angle:
This study describes a market. Sorank measures your site: which questions mention you, which mention someone else, and what to publish to change that, tracked weekly across the same five AI.
Start with 3 days free. A payment card is required to open the trial.

YouTube at 6.53%, ahead of Spotify at 4.26% and Apple at 3.18%. The full ranking is on this page, and the source data is public on data.sorank.com.
On 301025 answers from five AI, collected between August 2025 and August 2026, with every cited source extracted and normalised. The citation rate is the number of citations per 100 measured answers. The public dataset is on data.sorank.com.
For journalists, yes. For AI citations, the measured weight sits with catalogue and video platforms, so the press kit should feed those entries rather than live alone on your site.
THEY TRIED SORANK BEFORE YOU
 “I tested Sorank on a real client site and it's insane. It does everything an agency would bill you $1500 a month for. It's going into production on that client now.”
 Guillaume Guersanguersanguillaume.com“We are an Ads agency and we wanted to get our SEO back on track once and for all. Sorank gave us a clear view of our site, helped us prioritize optimizations, and properly structure our content. The tool is easy to use, well designed for a team, and very practical for centralizing tracking without having to juggle multiple platforms. A very solid foundation to start fresh with our SEO.”
 Gaspard MadouiAds Agency
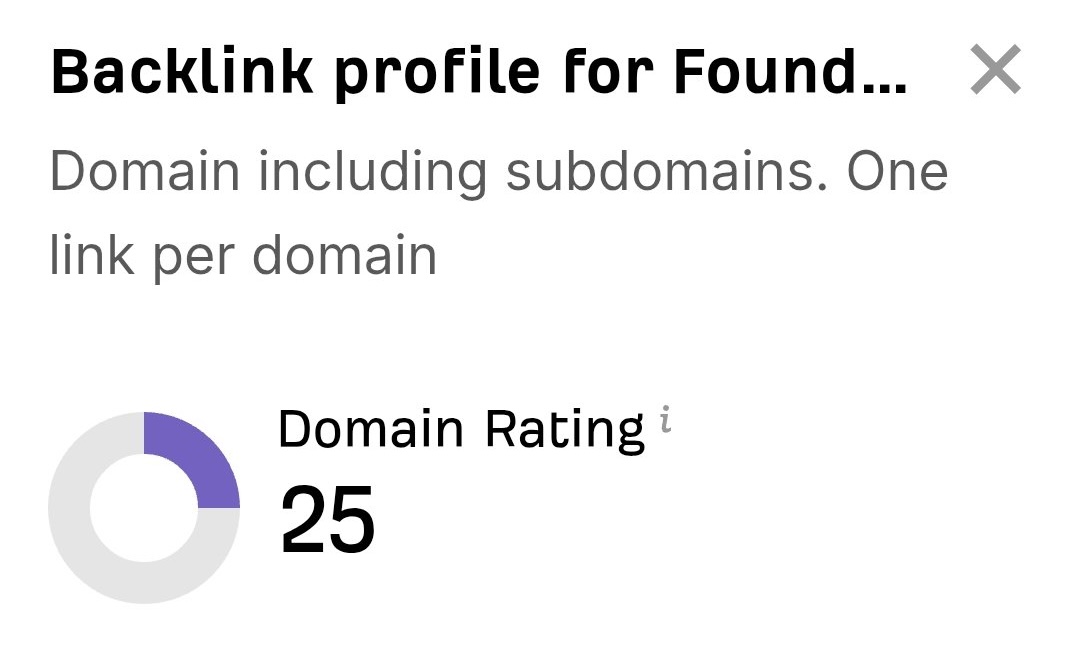 “I just let the Sorank software do its thing, and now my DR is 25 and my page is ranking higher.”
 Lucas FlandrePodcast Host“I specialized in GEO thanks to Sorank. The GEO Leaderboard allows me to show my clients their position vs competitors on ChatGPT. It’s a real commercial differentiator.”
 MélanieSEO Freelance“Great service, works well for our website and helps us understand how to improve it to rank better on Google and elsewhere. Congrats, keep going, I recommend it.”
 Hugo T.E-commerce merchant